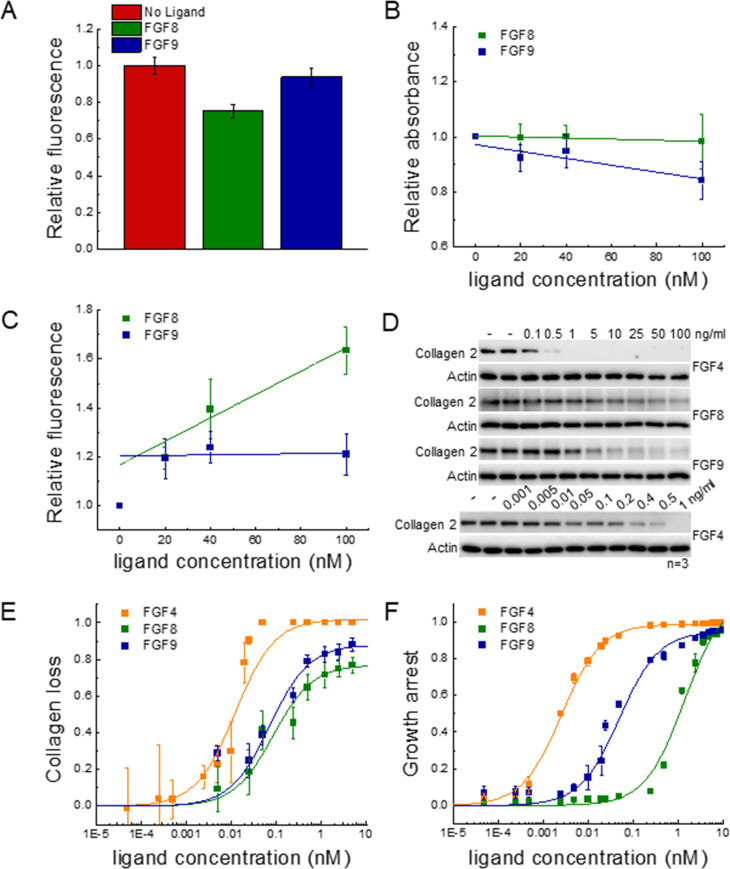
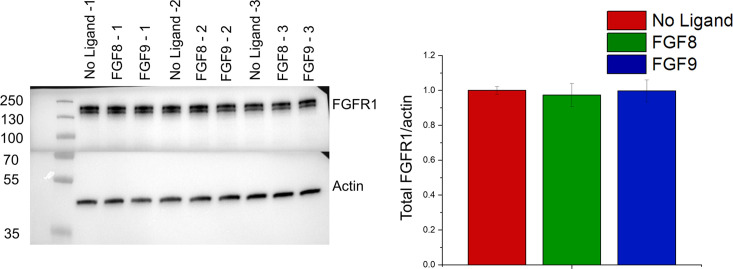
Figure 5. Functional FGFR1-mediated responses to different ligands.
(A) FGFR1 concentration in the plasma membrane of HEK 293T cells at t=2 min following ligand addition for FGF8, FGF9, and no ligand control. (B) HEK 293T cell viability after ligand exposure and 6 days of starvation for varying ligand concentrations. (C) Apoptosis of HEK 293T cells under starvation conditions, exposed to varying concentrations of FGF8 and FGF9. Results are summarized in Supplementary file 5. (D) RCSFgfr1 cells were treated with FGF4, FGF8, and FGF9 for 48 hr, and the levels of collagen type 2 were determined by western blot. Actin serves as a loading control. (E) Dose-response curves describing collagen type 2 loss. (F) Dose-response curves for growth arrest of RCSFgfr1 cells after 72 hr, in response to FGF4, FGF8, and FGF9. Data are from at least three biologically independent experiments.


