. 2024 Apr 3;12:RP88750. doi: 10.7554/eLife.88750

Figure 4. HOG pathway mutants grow faster under in-phase stresses (IPS) than under alternating stresses (AS).

(a) Division rates measured during growth in IPS and AS conditions with 2% glucose and a fluctuation period of 24 min. Bars show the mean division rate measured in different growth chambers of the microfluidic chip. Error bars are 95% confidence intervals of the mean. Red symbols show the average division rate in each growth chamber. Results of t-tests comparing the wild-type and mutant strains under the same condition are indicated above each bar; results comparing the same strain under different conditions are shown above each pair of bars (ns: p>0.05; *0.01<p<0.05; **0.001<p<0.01; ***p<0.001). (b, c) Temporal dynamics of division rate during a period of 96 min in (b) IPS and (c) AS conditions for wild-type (black) and pbs2Δ mutant (green) cells. Each dot shows the division rate during a 6 min window centered on that dot and averaged for all fields of view sharing the same condition and all periods in the experiment (average of 16 to 30 measurements per dot). Gray and green areas are 95% confidence intervals of the mean division rate. Horizontal dotted lines show the mean division rate for all data collected in each half-period. The colored bars represent the periodic fluctuations in glucose (orange) and/or sorbitol (blue); hatching represents stress. The initial number of cells analyzed among replicates ranged from 97 to 467 in (a) and from 124 to 145 in (b, c).

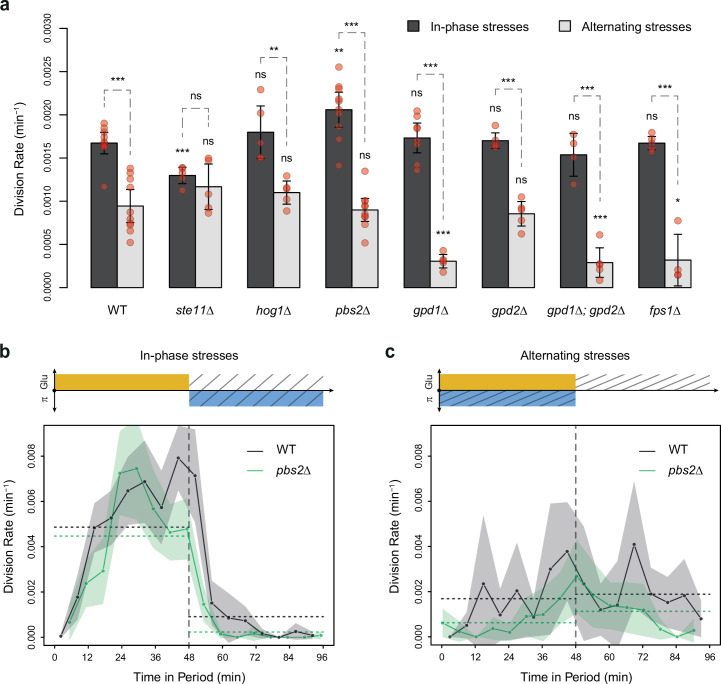
Figure 4—source data 1. Source data for Figure 4.

Figure 4.

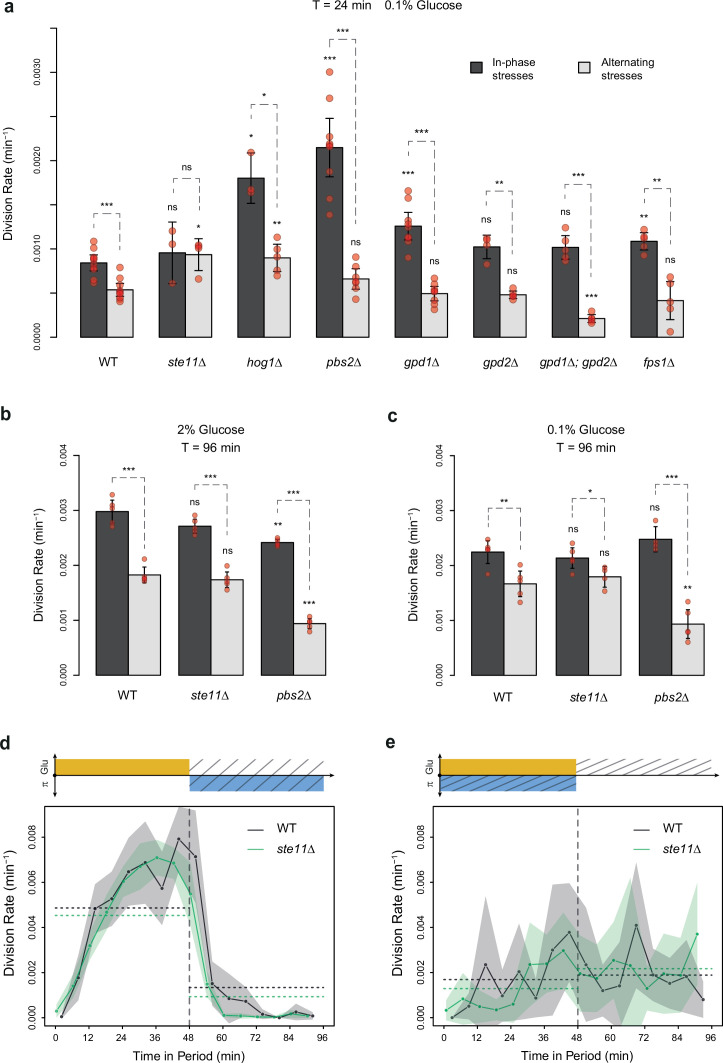
Figure 4—figure supplement 1. Division rates of HOG pathway mutants during in-phase stresses (IPS) and alternating stresses (AS) with different fluctuation periods and glucose concentrations.

Figure 4—figure supplement 1.

(a–c) Division rate of deletion mutants during growth in IPS and AS conditions with (a) a period of 24 min and 0.1% glucose, (b) a period of 96 min and 2% glucose, and (c) a period of 96 min and 0.1% glucose. Bars show the mean division rate among growth chambers sharing the same environmental conditions. Error bars are 95% confidence intervals of the mean. Red symbols show the average division rate for each growth chamber. Results of t-tests comparing the wild-type and mutant strains under the same conditions are indicated above each bar; results comparing the same strain under different conditions are shown above each pair of bars (ns: p>0.05; *0.01<p<0.05; **0.001<p<0.01; ***p<0.001). (d, e) Temporal dynamics of division rate during a period of 96 min in (b) IPS and (c) AS conditions for wild-type (black) and ste11Δ mutant (green) cells. Each dot shows the division rate during a 6 min window centered on that dot and averaged for all fields of view sharing the same condition and all periods in the experiment (average of 16 to 30 measurements per dot). Gray and green areas are 95% confidence intervals of the mean division rate. Horizontal dotted lines show the mean division rate for all data collected in each half-period. The colored bars represent the periodic fluctuations in glucose (orange) and/or sorbitol (blue); hatching represents stress. The initial number of cells analyzed among replicates ranged from 22 to 411 in (a), from 94 to 626 in (b), and from 67 to 206 in (c).
Figure 4—figure supplement 1—source data 1. Source data for Figure 4—figure supplement 1.
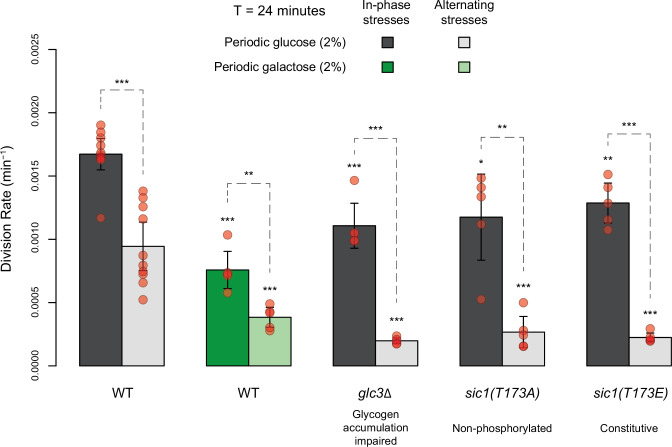
Figure 4—figure supplement 2. Comparing division rates during in-phase stresses and alternating stresses of wild-type cells exposed to periodic glucose (gray) or periodic galactose (green) and of mutant cells with impaired glycogen accumulation (glc3 deletion) or impaired cell cycle arrest in response to hyperosmotic stress (sic1 alleles).

Figure 4—figure supplement 2.

The period of environmental fluctuations is 24 min in all conditions. Bars show the mean division rate among growth chambers sharing the same environmental conditions. Error bars are 95% confidence intervals of the mean. Red symbols show the average division rate for each growth chamber. Results of t-tests comparing the wild-type and mutant strains under the same conditions are indicated above each bar; results comparing the same strain under different conditions are shown above each pair of bars (ns: p>0.05; **0.001<p<0.01; ***p<0.001). The initial number of cells analyzed among replicates ranged from 14 to 120.
Figure 4—figure supplement 2—source data 1. Source data for Figure 4—figure supplement 2.