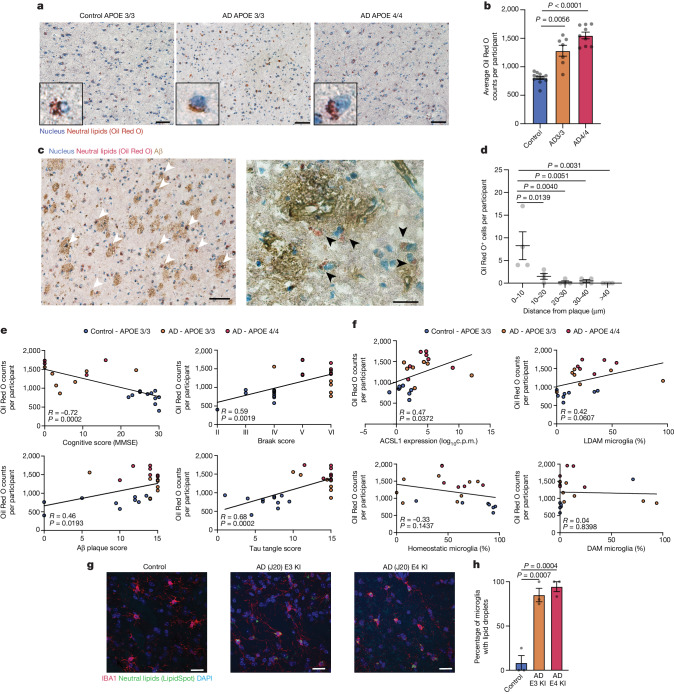
Fig. 2. Lipid accumulation is linked to AD pathology.
a, Representative Oil Red O staining image for control, AD-APOE3/3 and AD-APOE4/4 human frontal cortex. Neutral lipids stained with Oil Red O (red) and nuclei stained with haematoxylin (blue). Scale bars, 50 μm. b, Quantification of Oil Red O staining. Bar plots represent average Oil Red O counts per image for each individual category (control, n = 12; AD33 n = 7; AD44 n = 9 individuals). Each dot represents average Oil Red O counts for an individual averaged over five ×20 image fields per individual; one-way ANOVA; mean ± s.e.m. c, Left, Oil Red O staining of individuals with AD-APOE4/4 and with IHC for Aβ. White arrowheads represent Oil Red O+ cells in or around Aβ plaques. Scale bar, 50 μm. Right, high magnification of representative Oil Red O stain with IHC for Aβ in an individual with AD-APOE4/4. Black arrowheads represent Oil Red O+ cells in or around Aβ plaques. Scale bar, 20 μm. d, Quantification of the frequency of Oil Red O+ cells in various distances from Aβ plaques (n = 4 per group; one-way ANOVA; mean ± s.e.m.). e, Scatter plot of average Oil Red O counts per individual averaged over five ×20 image fields per individual with individual’s metadata. Individual category coloured blue for control, orange for individuals with AD-APOE3/3 and red for those with AD-APOE4/4. P values determined by Spearman correlation. f, Scatter plot of average Oil Red O counts per individual averaged over five ×20 image fields per individual with individual’s snRNA-seq data. Individual category coloured blue for control, orange for individuals with AD-APOE3/3 and red for those with AD-APOE4/4. P values determined by Spearman correlation. g, Representative immunofluorescence images of mouse hippocampus tissue stained for microglia marker IBA1 (red), neutral lipids (LipidSpot, green) and DAPI (blue) in control age-matched non-transgenic mice (left), AD mouse model (J20) with human APOE3 knockin (middle) and AD mouse model (J20) with human APOE4 knockin (right). Scale bars, 20 μm. h, Quantification of average percentage of IBA1+ microglia with neutral lipid dye (LipidSpot) (n = 3 individual mice per group; one-way ANOVA; mean ± s.e.m).

