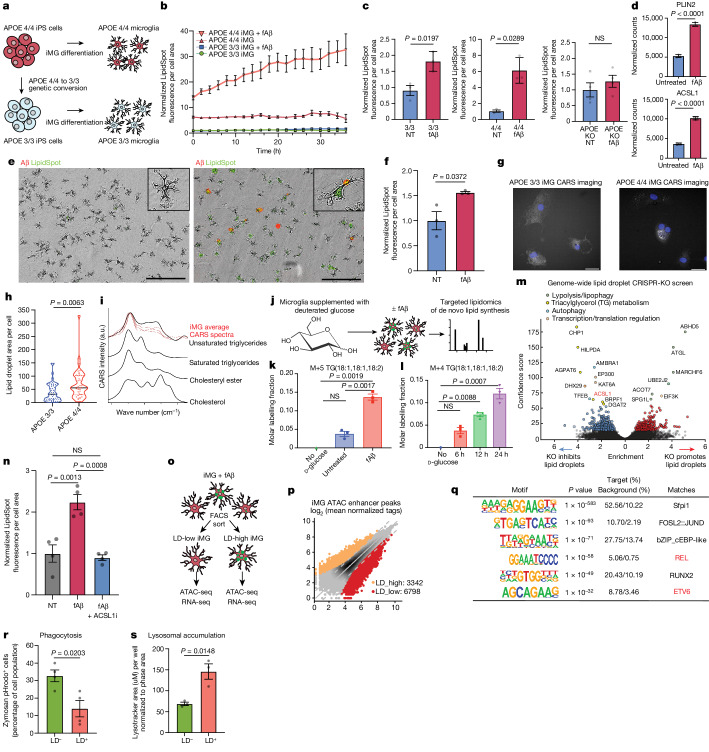
Fig. 3. iMG increase ACSL1 and triglyceride lipid synthesis after fAβ challenge.
a, Schematic of APOE3/3 and APOE4/4 iMGs. b, Quantification of lipid fluorescent dye (LipidSpot) in APOE3/3 and APOE4/4 iMG ± fAβ (n = 3 replicate wells per condition; mean ± s.e.m.). c, Average LipidSpot fluorescence per cell normalized to the not treated (NT) condition at final time point in b. Individual dots represent replicate wells (n = 3 replicate wells per condition; unpaired two-sided t-test; per condition, mean ± s.e.m). d, Normalized gene expression counts for significant differentially expressed genes in APOE4/4 iMG ± fAβ (n = 3 replicate wells per condition, P values determined by DEseq2; mean ± s.e.m). e, Primary rat microglia untreated (left) or with fAβ (right) with LipidSpot. Scale bar, 200 μm. f, Average LipidSpot fluorescence per cell normalized to untreated images in e (n = 3 replicate wells per condition; unpaired two-sided t-test; mean ± s.e.m). g, CARS images of APOE4/4 and APOE3/3 iMG ± fAβ. Scale bars, 20 μm. Data replicated in at least two independent experiments. h, Quantification of CARS microscopy. Each dot represents lipid measurements from individual cells (APOE33 n = 47; APOE44 n = 38; unpaired two-sided t-test). i, CARS spectra from fAβ-treated iMG (red) and reference spectra for common lipid species (black). j, Schematic of lipidomics measurement of d-glucose13C incorporation in BV2 cells + fAβ. k, Incorporation of d-glucose13C into triglycerides in microglia ± fAβ (n = 3 replicate wells per condition; one-way ANOVA; mean ± s.e.m). l, Incorporation of d-glucose13C into triglycerides in Aβ-treated microglia over time (n = 3 replicate wells per condition; one-way ANOVA; mean ± s.e.m). m, Volcano plot of genome-wide CRISPR-KO LD screen in U937 cell line. Genes passing a 10% FDR cutoff are highlighted in red and blue. n, Average LipidSpot fluorescence ± ACSL1 inhibitor (Triacin C) (n = 4 replicate wells per condition; unpaired two-sided t-test; mean ± s.e.m.). o, Schematic of ATAC-seq and RNA-seq in LD-high and LD-low iMGs. p, ATAC-seq peaks in LD-high versus LD-low iMGs. q, Motif analysis of differential peaks. Motifs enriched in lipid-associated macrophages are highlighted in red. r, Average percentage pHrodo zymosan+ iMGs ± LD (n = 4 replicate wells per condition; unpaired, two-sided t-test; mean ± s.e.m.). s, Average percentage lysotracker+ iMGs ± LD (n = 3 replicate wells per condition; unpaired, two-sided t-test; mean ± s.e.m.). KO, knockout; NS, not significant. Elements in j created with BioRender.com.

