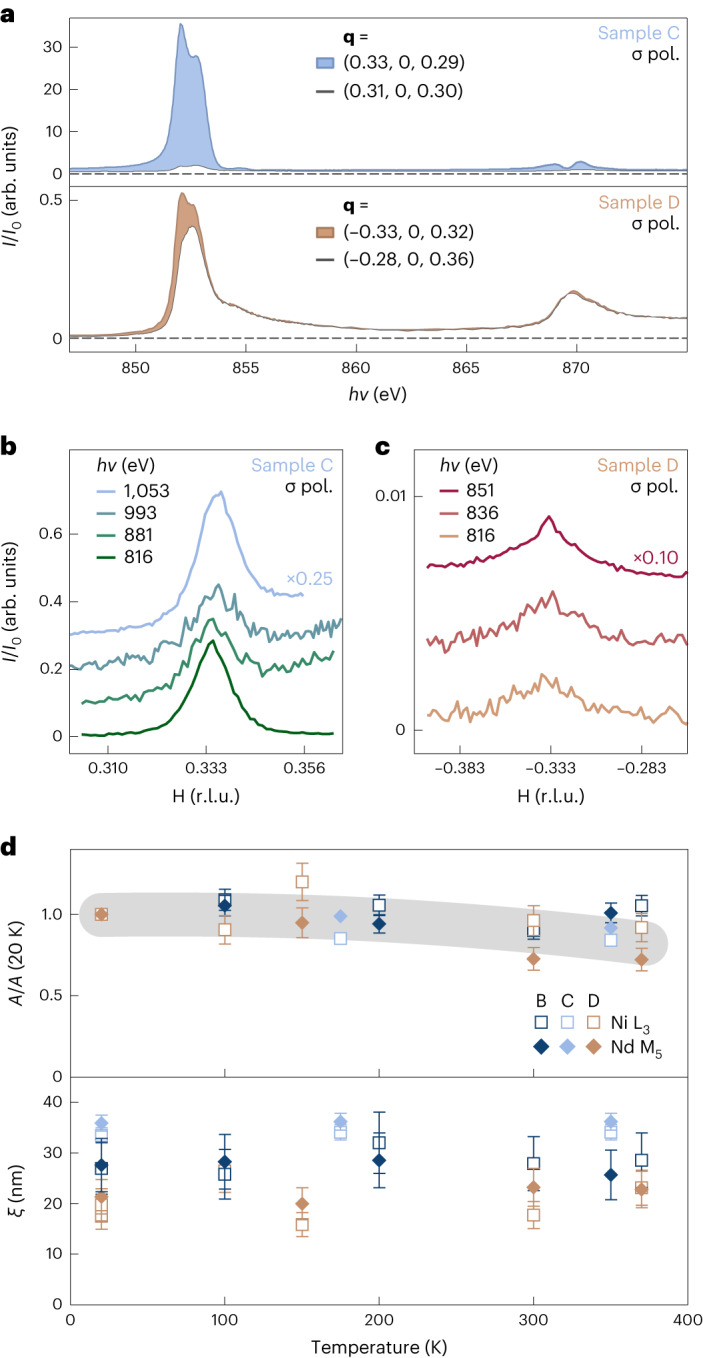
Fig. 3. Energy and temperature dependence of the q = (1/3, 0) scattering peak.

a, Fixed-wavevector resonant energy profiles both on and off the scattering peak for samples C and D. The shaded region indicates intensity attributable to the resonant scattering above the fluorescent background (white). b,c, Rocking curves through q = (1/3, 0) for a wide range of photon energies around the Ni L and Nd M resonances for sample C (b) and sample D (c); traces have been vertically offset for clarity, but no background subtraction has been applied. d, Temperature dependence of peak amplitude A and correlation length ξ = 2π/Δq, at both edges for samples B–D. The error bars represent the fitting uncertainty in the extracted quantities (A and ξ); they define the range of values obtained by fitting the RSXS data with different models of the fluorescence background (that is, different polynomial degrees and fits over different ranges). The grey line is a guide to the eye.
