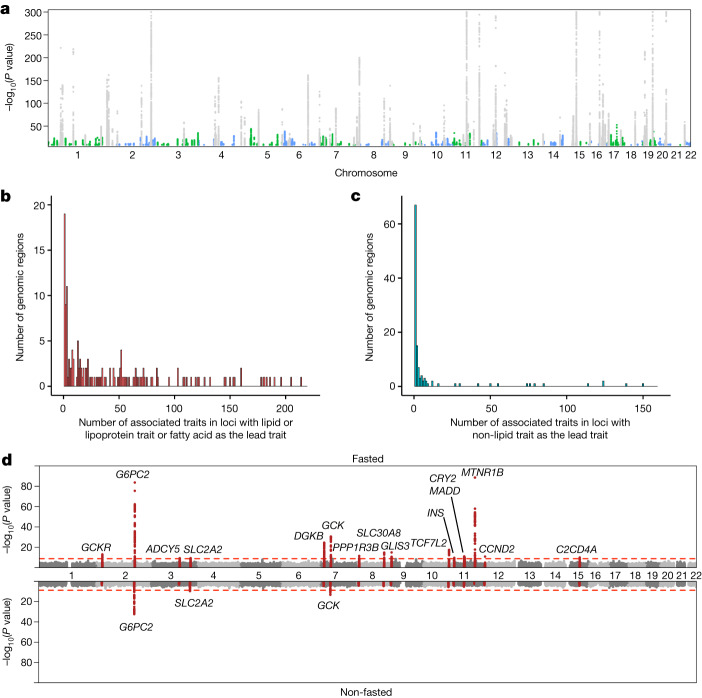
Fig. 1. Results of the GWAS meta-analysis of 233 metabolic traits.
a, Manhattan plot summarizing the metabolic trait associations from inverse variance-weighted GWAS meta-analysis. Loci that do not overlap with those identified in the previous large-scale NMR metabolomics GWAS4,5 are shown in blue and green. Only genome-wide significant SNPs (two-sided P < 1.8 × 10⁻⁹) are shown and −log10(P values) were capped at 300. b,c, Numbers of associated metabolic traits at the 276 associated genomic regions are shown separately for genomic regions in which the lead trait was a lipid, lipoprotein or fatty acid trait (b; 155 loci; median 24 traits per locus) and for those in which the lead trait was a non-lipid trait (c; 121 loci; median one trait per locus). d, Results of the GWAS for glucose for the fasted (top; total n = 68,559) and non-fasted (bottom; total n = 58,112) cohorts. The red line indicates the threshold for genome-wide significance. The 500-kb regions around lead SNPs in the fasted cohorts are highlighted.

