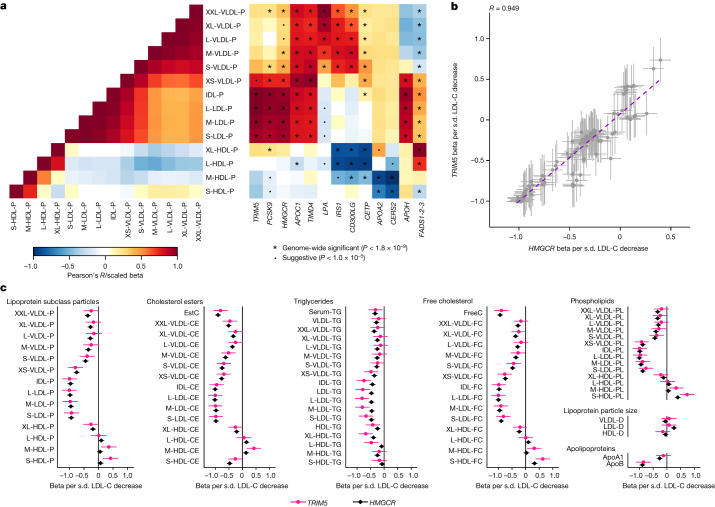
Fig. 2. Effects of SNPs across lipoprotein and lipid traits.
a, Heat maps of the correlation structure of lipoprotein subclass particle concentrations (left) and the association landscapes of exemplar SNPs (right). In the heat maps, pairwise correlations of lipoprotein subclass particle concentrations (calculated in FINRISK 1997; left) and effect estimates for the SNP–metabolic trait associations (right) are represented as a colour range. The SNP effect sizes were scaled relative to the absolute maximum effect size in each locus. Each column represents a single SNP, and each row corresponds to a single metabolic measure. Two-sided tests were used. b,c, Scatter plot (b) and forest plots (c) of the effect estimates (betas and 95% confidence intervals) for TRIM5 and HMGCR lead SNPs (rs11601507 and rs12916, respectively; n = 136,016 individuals) across the lipoprotein and lipid traits. b, A best fit regression line (purple dashed line) and an estimate of Pearson’s correlation coefficient R (for betas of 116 SNP–trait pairs) are shown. The effect estimates (s.d. units) were scaled relative to a one-s.d. decrease in LDL cholesterol. VLDL, LDL, IDL and HDL are classified into different particle sizes (in order of decreasing size: XXL, XL, L, M, S and XS). Detailed descriptions of the metabolic traits and abbreviations are shown in Supplementary Table 2. ApoA1, apolipoprotein A1.

