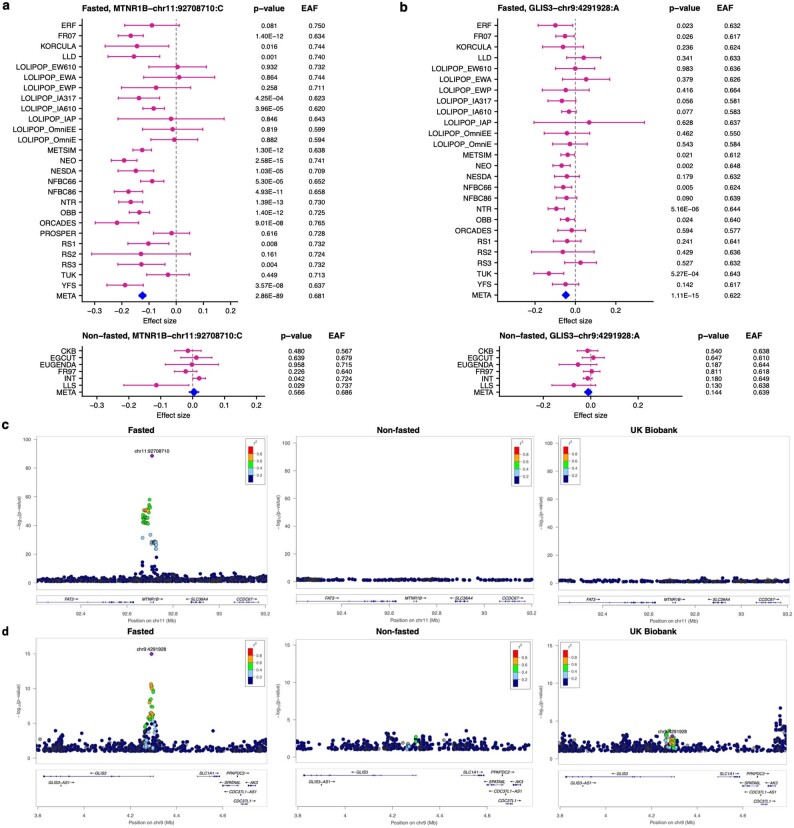
Extended Data Fig. 3. Examples of glucose associations for fasted and non-fasted cohorts.
The forest plots in panels a and b show examples of two lead SNPs in which glucose associations were significant in the fasted cohorts (top; n = 68,559) and non-significant in the non-fasted cohorts (bottom; n = 58,112). The associations were analyzed by inverse variance weighted GWAS meta-analysis. These associations were absent in the UK Biobank. Effect sizes (betas and 95% confidence intervals), effect allele frequencies (EAF) and p-values are indicated for each cohort. Cohort acronyms can be found in Supplementary Table 1. Panels c and d show regional association plots of the MTNR1B (c) and GLIS3 (d) loci in the fasted (left) and non-fasted (center) cohorts and in UK Biobank (right). SNPs with p < 0.1 are shown. 500-kb flanking regions around each lead SNP are shown. The linkage disequilibrium values (r2) are based on the 1000Genomes European population.

