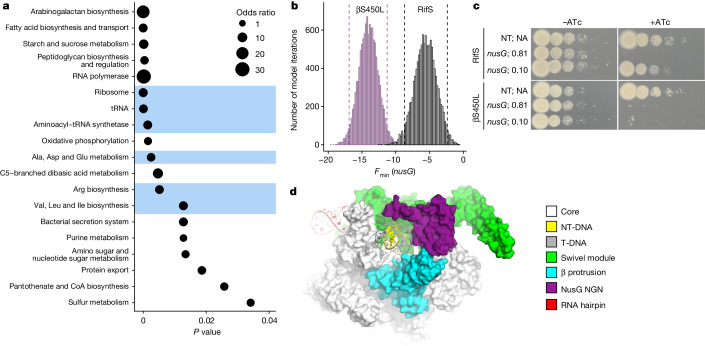
Fig. 2. Pathway analysis identifies differentially vulnerable processes in βS450L Mtb.
a, Bubble plot of enriched (P ≤ 0.05) pathways for the genes identified as differential vulnerabilities in βS450L. Pathways highlighted in blue are related to translation. P values and odds ratios were determined by Fischer’s exact test. b, The distribution of nusG Fmin values in RifS (grey) and βS450L (purple) Mtb. Dashed lines represent the 95% credible region. c, Phenotypic consequences of strong and hypomorphic knockdown of nusG (sgRNA predicted strength = 0.81 and 0.10, respectively, where 1.0 represents the strongest possible sgRNA) in RifS and βS450L Mtb. NT, non-targeting sgRNA. d, Structure of paused Mtb RNAP bound to NusG. The RNAP swivel module was defined by Delbeau et al.13.

