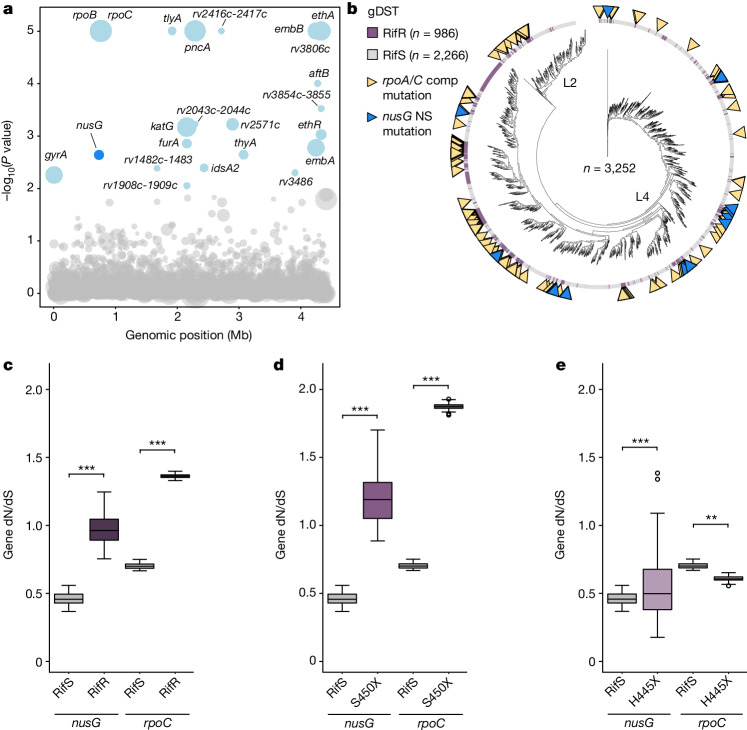
Fig. 3. NusG mutations are associated with RifR in clinical Mtb isolates.
a, Manhattan plot showing the genetic association with RifR among 3,252 clinical Mtb isolates from Peru. Each circle represents a gene or intergenic region in the Mtb genome. The y axis represents uncorrected phyOverlap P values (blue, P ≤ 0.05). Circle sizes are scaled by the number of independent mutations observed for that gene or intergenic region. P values were derived from 50,000 permutations of mutations events, as described in Methods. b, Phylogenetic tree of Peruvian Mtb isolates from a. Mycobacterium canetti was included as an outgroup; isolates from lineages 2 and 4 (L2 and L4) are indicated. Purple lines represent isolates identified as RifR by genotypic drug susceptibility testing (gDST). Yellow triangles mark isolates with a known compensatory (comp) mutation in rpoA/C (Supplementary Table 2) and blue triangles mark isolates harbouring a nonsynonymous (NS) mutation in nusG. c–e, Box plots showing the ratio of nonsynonymous to synonymous mutations (dN/dS) for nusG and rpoC in genotypically predicted RifS (nusG, n = 1,365; rpoC, n = 15,834) and RifR (nusG, n = 350; rpoC, n = 10,418) Mtb (c), restricting the analysis to only RifR strains with mutations in Ser450 (nusG, n = 270; rpoC, n = 7,898) (d), or restricting the analysis to only RifR strains with mutations in His445 (nusG, n = 26; rpoC, n = 996) (e). X indicates any amino acid except Ser (S450) or His (H445). The centre line represents the mean, box edges delineate top and bottom quartiles, and whiskers indicate the minimum and maximum dN/dS values. P values by independent two-sample t-test. Two-sided P values: **P = 1.14 × 10⁻³, ***P ≤ 0.0001.

