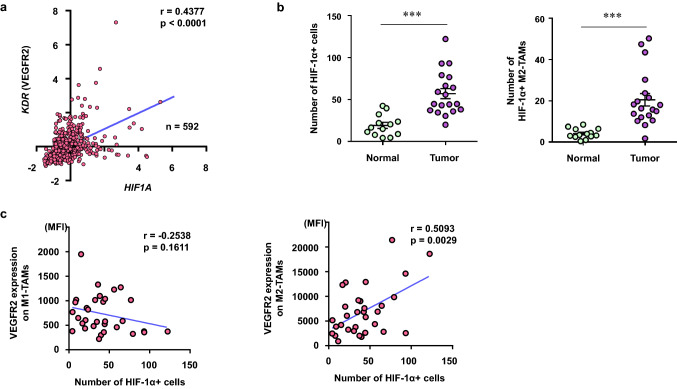
Fig. 3.
HIF1-α+ M2-TAMs increased in the tumor. a mRNA expression z-scores in 592 samples with colorectal adenocarcinoma were obtained from TCGA (PanCancer Atlas) dataset. Correlation of KDR (VEGFR2) with HIF1A. b The number of HIF-1α+ cells (left) and HIF-1α+ M2-TAMs (right) in the normal mucosa (normal) and the tumor (tumor). c The summary of correlation of VEGFR2 expression on M1-TAMs (CD14+ CD11c+ CD163−) and M2-TAMs (CD14+CD11c−CD163+) from flow cytometric analysis with the number of HIF-1α+ cells from immunofluorescence staining analysis in each patient. ***p < 0.001

