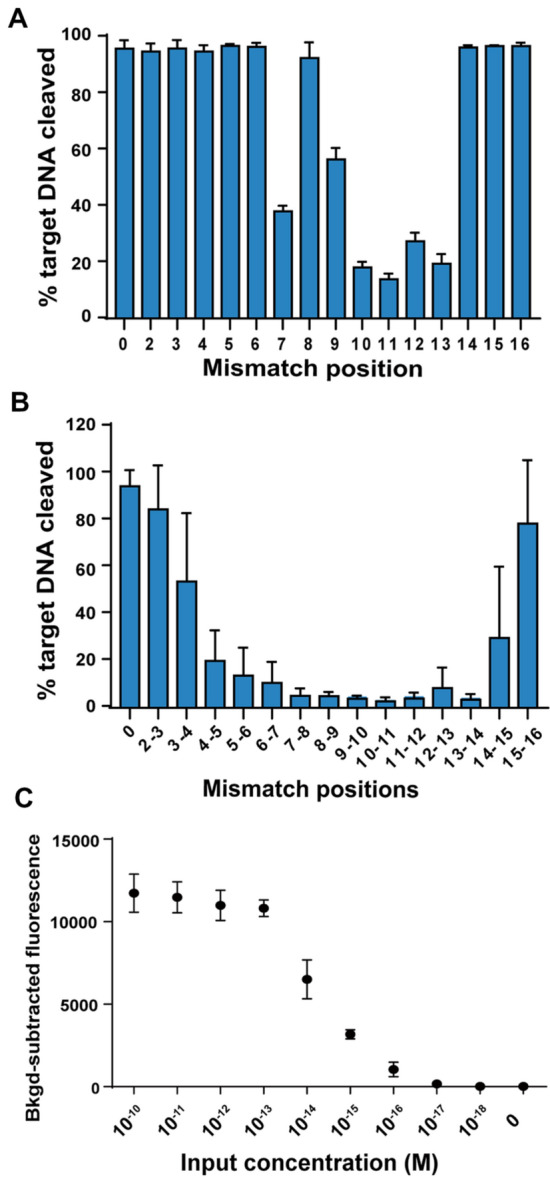
Fig. 3.

The specificity and sensitivity of RADAR detection. Observed activity for PfAgo using a fluorophore-labeled ssDNA with the indicated single nucleotide mismatches (A) and di-nucleotide mismatches (B). PfAgo cleavage kinetics of ssDNA targets were measured, and the cleavage activity at the 20 min time point was plotted against the mismatch position. Ratios represent the average of three different targets measured in triplicate, and error bars represent mean ± s.d., where n = 9 (three replicates for three independent targets. C Detection sensitivity of the RADAR system using diluted plasmids. Error bars represent the mean ± s.d., n = 3
