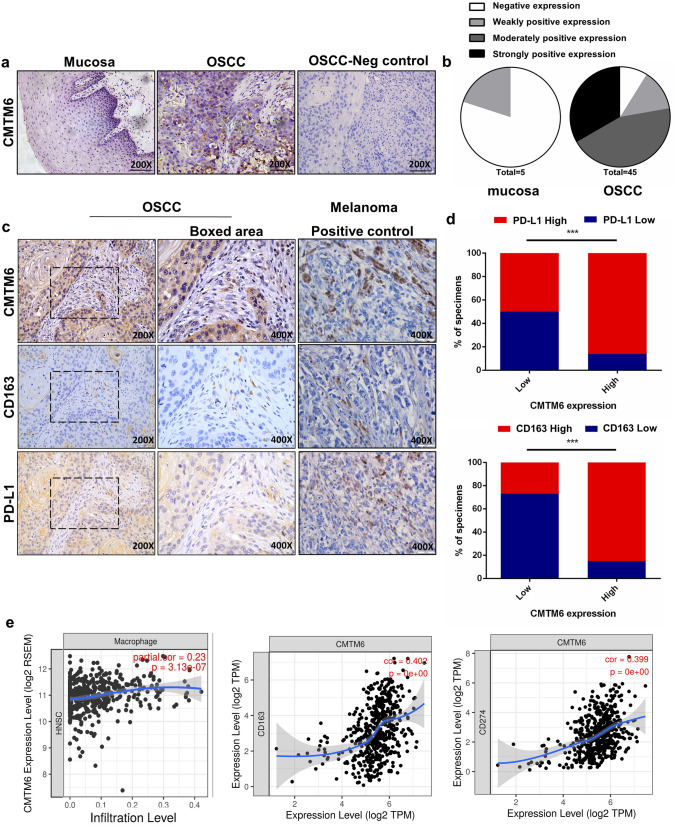
Fig. 1 .
Representative immunohistochemical images of oral mucosa and OSCC sections. a Representative images of CMTM6 immunohistochemical expression and negative control (PBS was added instead of primary antibodies in OSCC tissue microarrays (scale bar: 100 µm). b Histoscores for CMTM6 expression in oral mucosa and OSCC sections. c Representative images of OSCC tissues stained for CMTM6, PD-L1 and CD163 (scale bar: 100um and boxed area scale bar: 50 um) and melanoma tissues stained for CMTM6, PD-L1 and CD163 for positive control (scale bar: 50 um). d Percentage of specimens showing low or high CMTM6 expression in relation to the expression levels of PD-L1 and CD163. The Chi square test was used to analyze statistical significance. e Analyzes of Tumor IMmune Estimation Resource (TIMER) databases showed the association between CMTM6 expression with macrophages infiltration and CD163, PD-L1 expression based on RNA-seq in head and neck squamous cell carcinoma (HNSCC). *p < 0.05, **p < 0.01, ***p < 0.001

