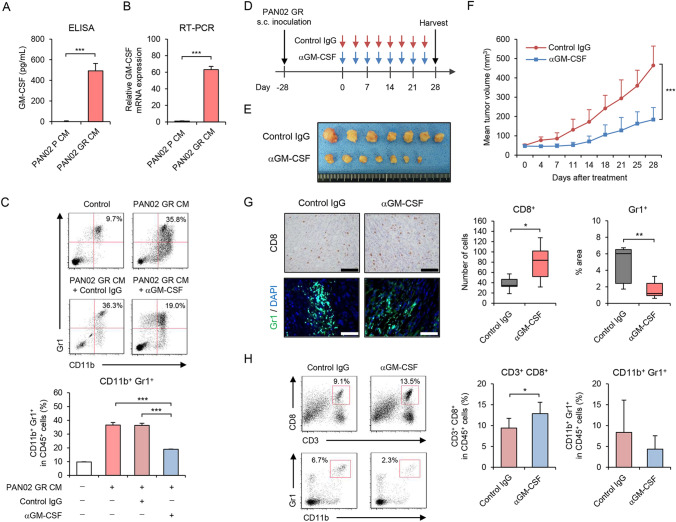
Fig. 3.
Anti-GM-CSF antibody treatment suppresses tumor growth and immunosuppressive TME induced by GR PAN02 cells. A Conditioned medium (CM) of P and GR PAN02 cells was used to analyze the amount of extracellular GM-CSF using ELISA. B Expression of GM-CSF mRNA was analyzed using quantitative RT-PCR. GM-CSF mRNA expression of GR PAN02 cells was calculated relative to that of P cells, which was set at 1.0. C Representative data of flow cytometric analysis for CD11b and Gr1 in each group. The percentage of CD11b+Gr1+ MDSCs among CD45+ cells is shown. Data are expressed as mean ± SD (n = 3 in each group). D GR PAN02 cells (4 × 10⁶ cells/site) were inoculated into the flanks of C57BL/6J mice on day − 28. Anti-GM-CSF antibody (red arrows) or control isotype IgG (blues arrows) was intraperitoneally administered twice a week for four cycles. E Photographs of tumors in control isotype IgG and anti-GM-CSF antibody groups. F Tumor growth curves of control IgG- and anti-GM-CSF antibody-treated PAN02 tumors. G Representative photographs of immunohistochemical staining for CD8+ T cells or Gr1+ MDSCs in each group. Scale bars, 100 µm. The number of CD8+ T cells and percent area of Gr1+ MDSCs were calculated from five different randomly selected fields. H Representative data of flow cytometric analysis of CD3, CD8, CD11b, and Gr1 in each group. The percentages of CD3+CD8+ T cells and CD11b+Gr1+ MDSCs among CD45+ cells are shown. Data are expressed as mean ± SD (n = 7 in each group; *P < 0.05; **P < 0.01; ***P < 0.001)

