Fig. 4.
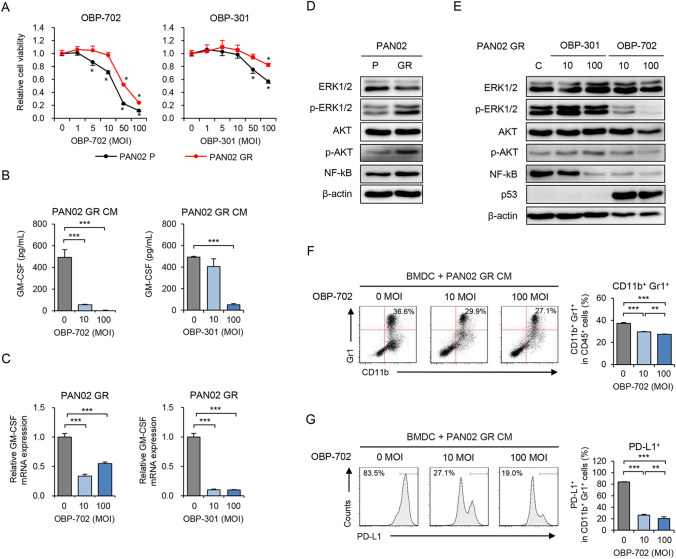
OBP-702 suppresses GM-CSF production, oncogenic signals, and MDSC differentiation induced by GR PDAC cells. A P and GR PAN02 cells were treated with OBP-301 or OBP-702 at the indicated MOIs for 72 h. Cell viability was quantified using the XTT assay. Cell viability was calculated relative to that of the mock-infected group, which was set at 1.0. Cell viability data are expressed as mean ± SD (n = 5 in each group). B CM of GR PAN02 cells treated with OBP-702 or OBP-301 at the indicated MOIs for 72 h was used to analyze the amount of extracellular GM-CSF using ELISA. C Expression of GM-CSF mRNA in GR PAN02 cells treated with OBP-702 or OBP-301 at the indicated MOIs for 72 h was analyzed using quantitative RT-PCR. GM-CSF mRNA expression of GR PAN02 cells was calculated relative to that of P cells, which was set at 1.0. D Cell lysates of P and GR PAN02 cells were subjected to Western blot analysis of ERK1/2, phosphorylated ERK1/2, AKT, phosphorylated AKT, and NF-kB. β-Actin was assayed as a loading control. E GR PAN02 cells were infected with OBP-301 or OBP-702 at the indicated MOIs for 72 h. Cell lysates were subjected to Western blot analysis of ERK1/2, phosphorylated ERK1/2, AKT, phosphorylated AKT, NF-kB, and p53. β-Actin was assayed as a loading control. F Representative data of flow cytometric analysis of CD11b and Gr1 in each group. The percentage of CD11b+Gr1+ MDSCs among CD45+ cells is shown for BMDCs incubated with GR PAN02 CM and OBP-702 at the indicated MOIs. G Representative data of flow cytometric analysis of PD-L1 in each group. The percentage of PD-L1+ cells among CD11b+Gr1+ MDSCs is shown for BMDCs incubated with GR PAN02 CM and OBP-702 at the indicated MOIs. Data are expressed as mean ± SD (n = 3 in each group; *P < 0.05; **P < 0.01; ***P < 0.001)

