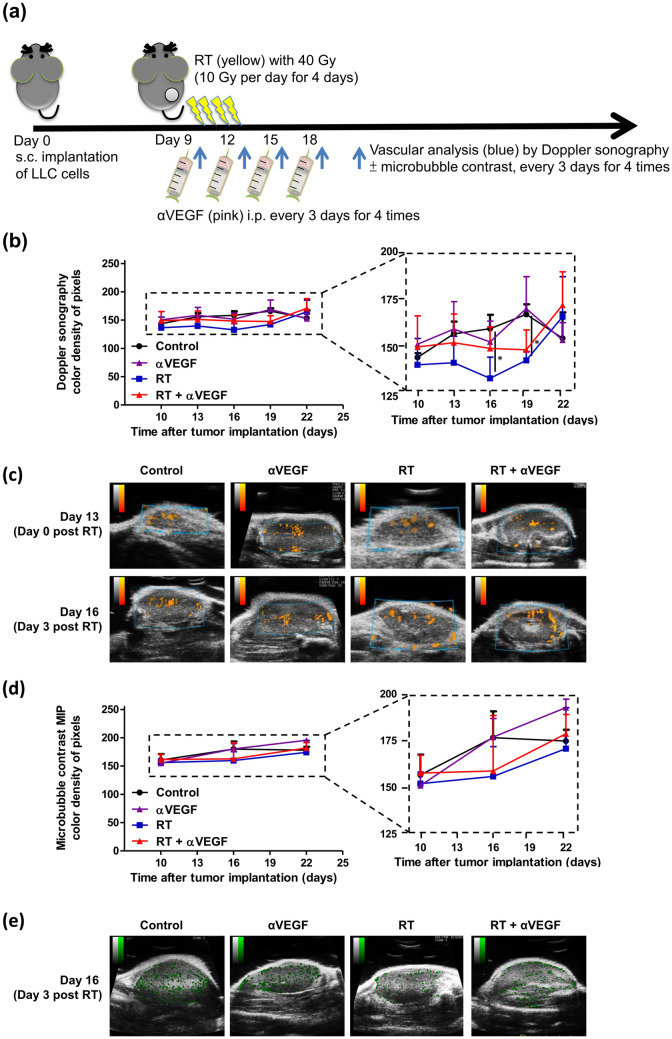
Fig. 2.
Tumor vasculature response to radiotherapy (RT) and anti-VEGF therapy. a C57BL/6 mice were subcutaneously injected into the flank with 2 × 10⁵ LLC cells. Once the tumor was established, mice were locally treated with 10-Gy dose/fraction of RT, one fraction per day, for 4 days, to a total dose of 40 Gy, and 100 µg anti-VEGF was administered intraperitoneally every 3 days for a total of four times. To assess tumor vasculature response to RT and anti-VEGF therapy, quantified power Doppler sonography was performed before RT and 0, 3, 6, and 9 days after RT, to assess vasculature response to RT (40 Gy) and anti-VEGF therapy. Ultrasonic contrast imaging using microbubble agents was performed before RT, as well as 3 and 9 days after RT, with maximal intensity projection (MIP) demonstrating the path of microbubbles throughout the tumor summation over time. The mean color density of pixel levels (b) and graphic representation (c) of power Doppler sonography; and mean color density of pixel levels (d) and graphic representations (e) of ultrasonic contrast imaging MIP from the control and treated mice are shown at the indicated time points. The color density of pixel levels ranged from 0 to 255. Higher values indicate more blood flow. *p < 0.05

