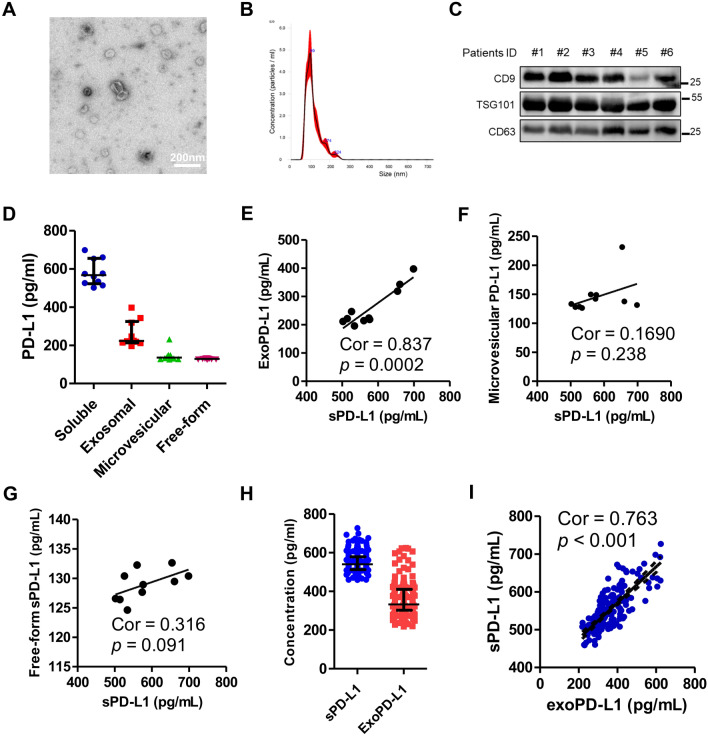
Fig. 1.
Isolated exosome characterization and the correlation between exoPD-L1 and sPD-L1. A A representative TEM image of purified exosomes from patients’ plasma. Scale bar, 200 nm. B Characterization of purified exosomes using nanoparticle tracking. C Representative immunoblots showing expression of CD9, TSG101 and CD63 in plasma exosomes derived from six patients. D Different PD-L1 expression levels of multiple forms isolated from ten patients. E Strong correlation between preoperative sPD-L1 and exoPD-L1 (P = 0.002, r = 0.837, n = 10). No correlation between preoperative F sPD-L1 and G microvesicular PD-L1 (P = 0.238, n = 10) and free-form sPD-L1 (P = 0.091, n = 10). H Expression levels of sPD-L1 and exoPD-L1 isolated from 177 patients in cohort 1. I Strong correlation between preoperative exoPD-L1 and sPD-L1 in cohort 1 (Spearman’s correlation at P < 0.001, r = 0.763, n = 177)

