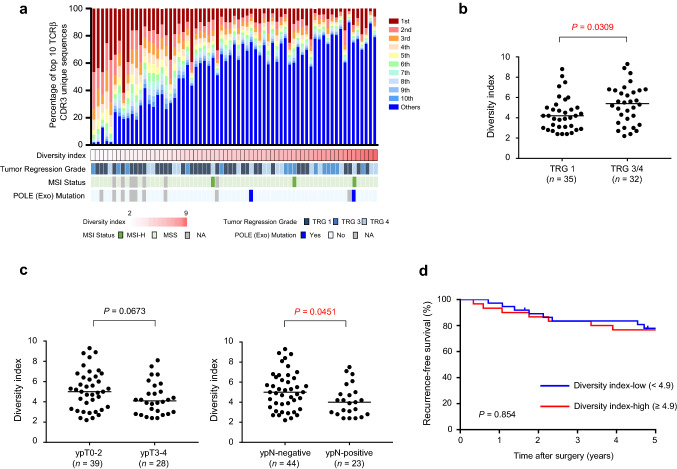
Fig. 1.
Response to preoperative chemoradiotherapy (CRT) and survival according to T-cell receptor (TCR) repertoire diversity. a Clonotypes for TCR repertoire of pre-treatment biopsy samples. Frequencies of top 10 clonotypes in a sample are presented as a colour map after sorting by diversity index. Diversity index is shown as a heatmap below the colour map. Tumor regression grade (TRG), microsatellite instability (MSI) status and mutational status of POLE exonuclease (exo) domain for each sample are shown. b TCR repertoire diversity index and tumor regression grade (TRG). The median value is represented by a horizontal line. Data were analysed using a Mann–Whitney U test. c TCR repertoire diversity index and post-CRT tumor and lymph node stage (left; ypT, and right; ypN). The median value is represented by a horizontal line. Data were analysed using Mann–Whitney U-tests. (d) Kaplan–Meier curves for recurrence-free survival by TCR repertoire diversity index. Groups were compared with the log-rank test

