Fig. 3.
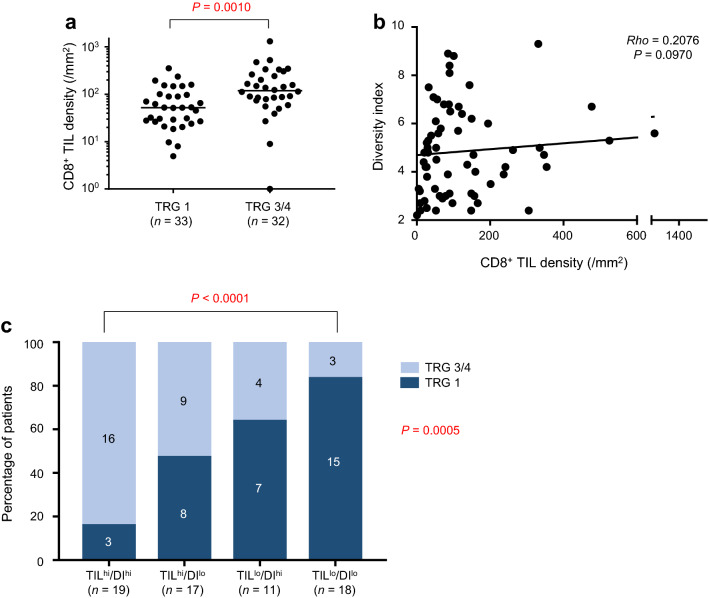
CD8+ tumor-infiltrating lymphocyte (TIL) density and T-cell receptor (TCR) diversity in response to preoperative chemoradiotherapy (CRT). a CD8+ TIL density and tumor regression grade (TRG). Horizontal line indicates median value. P value was computed by Mann–Whitney U test. b CD8+ TIL density and TCR diversity. Rho and P value were computed by Spearman’s correlation test. c Combinatory status of CD8+ TIL density and TCR diversity and TRG. P value was computed by χ2 test and Fisher’s exact test

