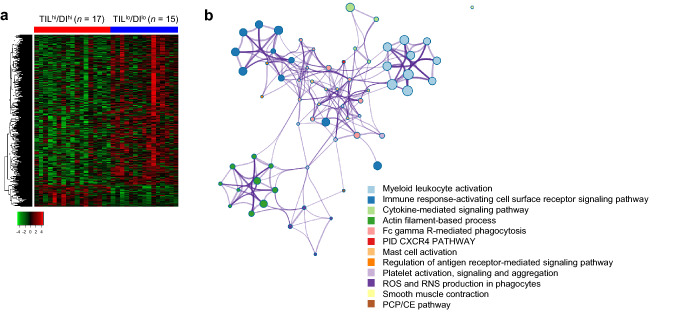
Fig. 4.
Differentially expressed genes between double-high and double-low tumors for CD8+ TIL density and TCR diversity. a Heatmap of differentially expressed genes. Expression levels of genes with q-value < 0.1 are shown (red; overexpressed, and green; underexpressed). Q-value was computed by Benjamini and Hochberg’s method. b Network of enriched clusters in the TILhi/DIhi group compared with the TILlo/DIlo group. Each node represents an enriched term, and node size is proportional to the number of input genes that fall into that term. The thickness of the node connection represents the term similarity, as calculated by Cohen kappa coefficient

