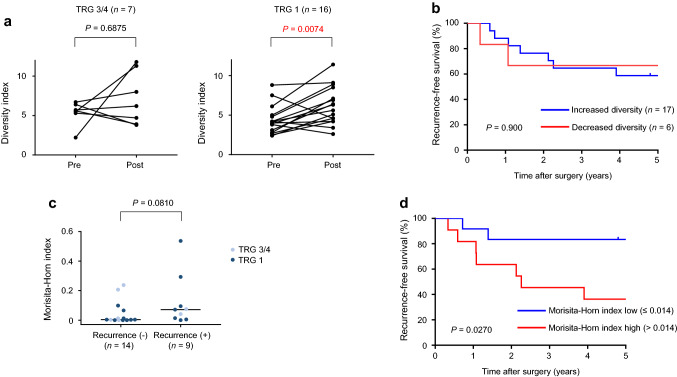
Fig. 5.
Alteration of T-cell receptor (TCR) repertoire before and after CRT. a Change in TCR diversity index before and after CRT in good responders (left; TRG 3/4) and non-responders (right; TRG 1). P value was computed by Wilcoxon matched-pairs signed rank test. b Kaplan–Meier curve analysis for recurrence-free survival between increased and decreased TCR repertoire diversity. P value was computed by the log-rank test. c Morisita–Horn index and recurrence. Horizontal line indicates median value. P value was computed by Mann–Whitney U-test. d Kaplan–Meier curve analysis for recurrence-free survival between high and low Morisita–Horn indices. P value was computed by the log-rank test

