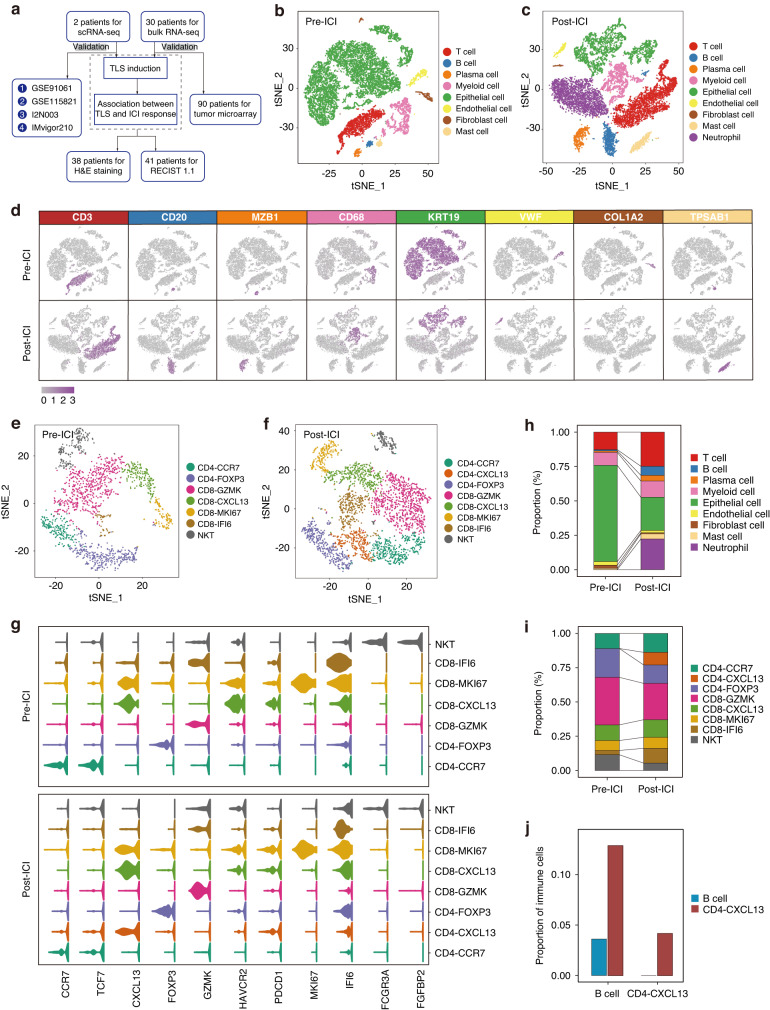
Fig. 1. Identification of TLS induction upon immunotherapy via scRNA-seq analysis.
a Flowchart of the overall study design. Cell type identification in pre-ICI (b) and post-ICI (c) samples, with tSNE plots depicting color-coded major cell types. d Feature plots illustrating marker genes of major cell types. T cell clusters in pre-ICI (e) and post-ICI (f) samples displayed by tSNE plots. g Violin plots representing marker genes of T cell clusters. h Relative abundance of major cell types in pre-ICI and post-ICI samples. i Relative abundance of T cell clusters in pre-ICI and post-ICI samples. j Comparison of proportions of B cells and CD4-CXCL13 T cells to total immune cells between pre-ICI and post-ICI samples.

