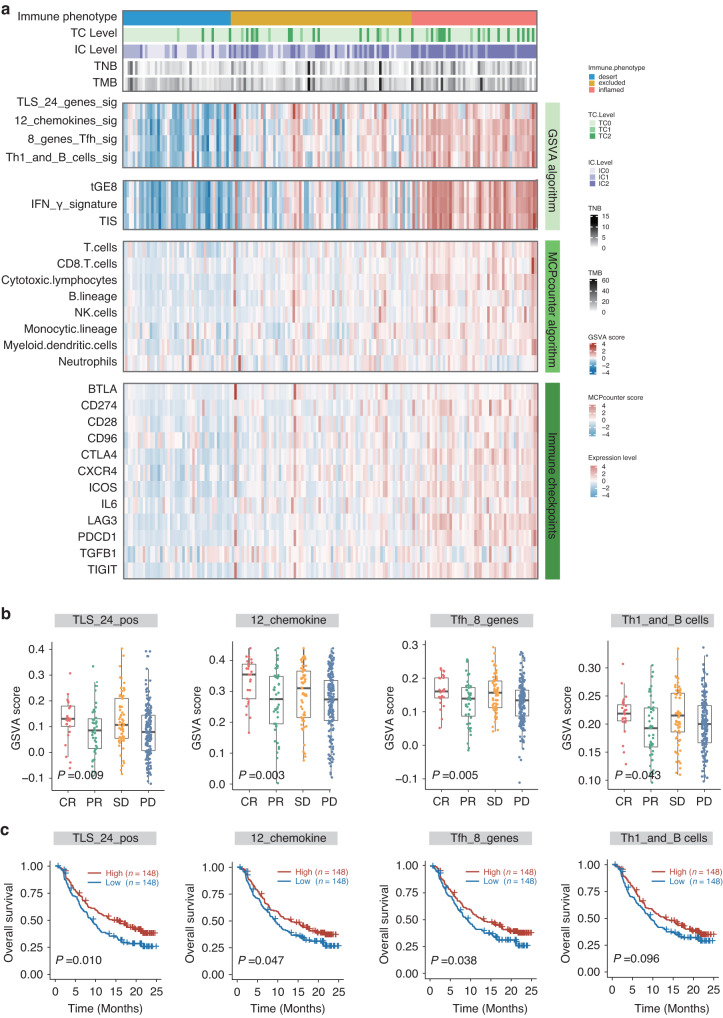
Fig. 3. Predictive value of TLS in immunotherapy.
a Heatmap illustrating the comprehensive landscape of immune phenotype, tumor cell (TC) level, immune cell (IC) level, tumor neoantigen burden (TNB), tumor mutation burden (TMB), TLS signature score, immune infiltrates signature score, immune cell population predicted by the MCPcounter algorithm, and immune checkpoint expression based on data from IMvigor210. b Box plots presenting GSVA scores of four TLS signatures stratified based on treatment responses. c Kaplan-Meier survival curves for ICI-treated patients from IMvigor210 stratified based on median GSVA scores of four TLS signatures.

