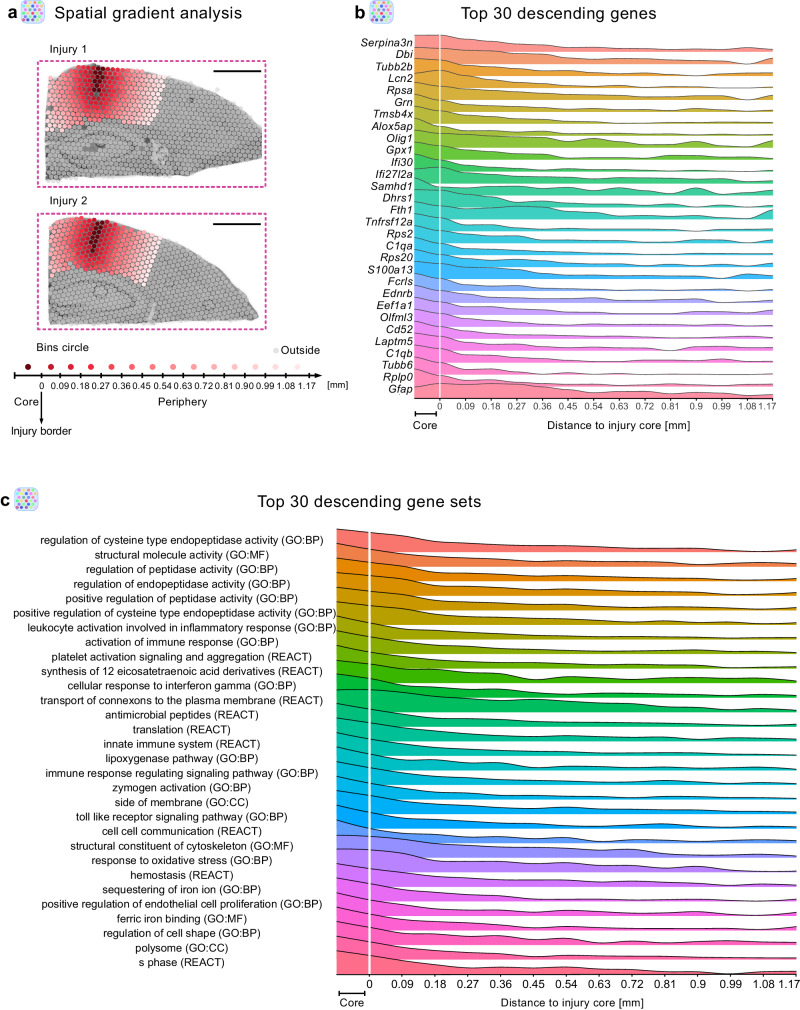
Fig. 2. Stab wound injury elicits distinct gene expression patterning along a spatial gradient.
a Paradigm for spatial transcriptomic gradient analysis on stab wound-injured mouse cerebral cortices (3 dpi) using the SPATA2 pipeline. Spatial gradient analysis was conducted only in cortical areas; from the injury core (dark red spots) toward the periphery (light pink) within 13 concentric circle bins. All other areas (gray spots) were neglected. b Ridge plot depicting the expression of the 30 most descending genes along the gradient, depicted as mean expression in two injuries (injury 1 and 2). c Ridge plot displaying the top 30 most descending gene sets along the gradient, depicted as mean expression in two injuries (injury 1 and 2). stRNAseq data are based on n = 1 animal over 1 experiment with two injured hemispheres being captured. Scale bars 1 mm. BP biological processes, MF molecular functions, CC cellular components, GO gene ontology, REACT reactome.

