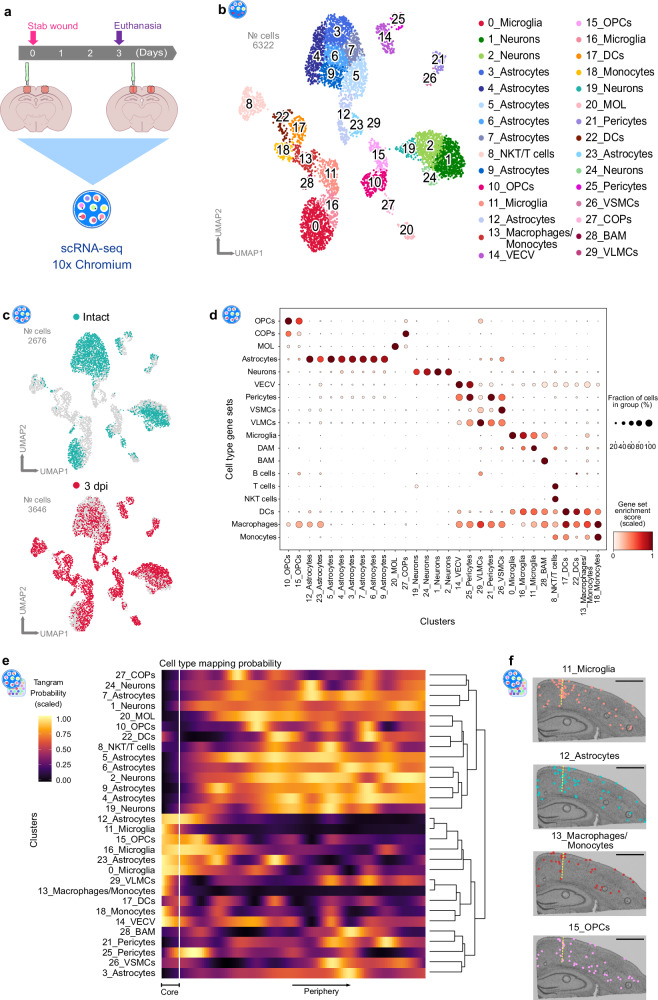
Fig. 3. Combination of spatial and single-cell transcriptomics identifies cellular populations contributing to distinct transcriptional responses at the injury site.
a Experimental scheme to conduct single-cell RNA-sequencing of intact and stab wound-injured cerebral cortices (3 dpi) with the 10x Genomics platform. Red masked areas on brain schemes indicate biopsy areas used for the analysis. b UMAP plot illustrating 6322 single cells distributed among 30 distinct clusters. Clusters are color-coded and annotated according to their transcriptional identities. c UMAP plot depicting the distribution of cells isolated from intact (green) and injured (red) cerebral cortices. d Dot plot indicating strong correlation of post hoc cluster annotation with established cell-type-specific gene sets (Supplementary Table 3). e, f 3 dpi scRNA-seq cluster localization along the spatial gradient (Fig. 2), based on probabilistic mapping with Tangram (e) and single-cell deconvolution (f) in a spatial context. scRNAseq data shown in this figure are derived from n = 3 intact animals over 1 experiment (1 scRNAseq libray) and n = 3 3dpi animals over 1 experiment (2 scRNAseq libraries). stRNAseq data are based on n = 1 animal over 1 experiment with two injured hemispheres being captured. Scale bars in (f): 1 mm. scRNA-seq single-cell transcriptomics, UMAP uniform manifold approximation and projection, dpi days post-injury, OPCs oligodendrocyte progenitor cells, COPs committed oligodendrocyte progenitors, MOL mature oligodendrocytes, VECV vascular endothelial cells (venous), VSMCs vascular smooth muscle cells, VLMCs vascular and leptomeningeal cells, DAM disease-associated microglia, BAM border-associated macrophages, NKT cells natural killer T cells, DCs dendritic cells.

