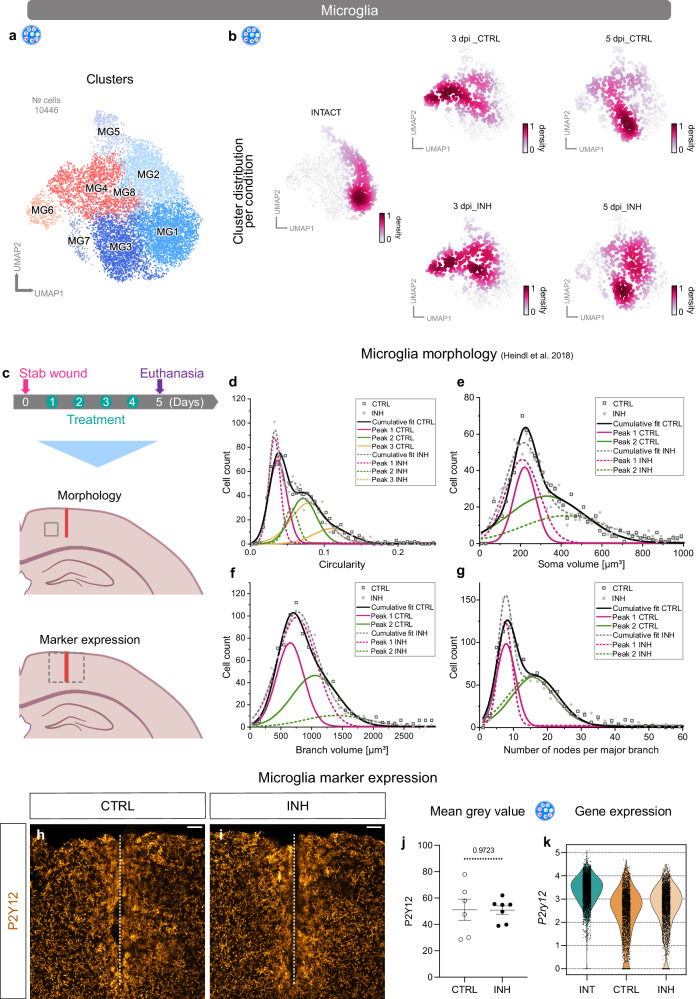
Fig. 7. Microglial reactivity following Cxcr3 and Tlr1/2 pathway inhibition.
a, b UMAPs illustrating subclusters of microglia (a) and cell distributions (b) among those subclusters at all time points (intact, 3 dpi, and 5 dpi) and conditions (CTRL and INH). Data shown in (b) are downsampled to an equal number of cells between time points and conditions. Data shown in panels (a) and (b) are derived from n = 12 intact animals over 3 independent experiments (5 scRNAseq libraries), n = 3 3dpi CTRL animals over 1 experiment (2 scRNAseq libraries), n = 3 3dpi INH animals over 1 experiment (2 scRNAseq libraries), n = 9 5dpi CTRL animals over 3 independent experiments (3 scRNAseq libraries) and n = 6 5dpi INH animals over 2 independent experiments (3 scRNAseq libraries). c Experimental paradigm to assess microglial reactivity. Gray boxes on the mouse brain schemes highlight the analyzed areas. Red lines indicate the injury cores. d–g Plots depicting the distribution of microglial circularity (d), soma volume (e), branch volume (f), and number of nodes per major branch (g) of nCTRL = 6 and nINH = 5 animals. Source data are provided as Source Data file. Data are fitted with multiple peak functions. The fit parameters are depicted in Supplementary Data 8 for each fit. h, i Representative images of P2Y12 staining in CTRL (h) and INH-treated (i) mice. Dashed white lines indicate the injury core. All images are full z-projections of confocal z-stacks. j Dot plot depicting the mean gray value of P2Y12+ signal in the injury vicinity of CTRL and INH-treated mice at 5 dpi. Data are shown as mean ± standard error of the mean. Each data point represents one animal. Source data are provided as Source Data file. Statistics have been derived from nCTRL = 6 and nINH = 7 animals. p-values were determined with unpaired t-test (two-tailed). k Violin plots depicting expression levels of P2ry12 in microglia (scRNA-seq) in intact, 5 dpi CTRL and 5 dpi INH condition. Data are derived derived from n = 12 intact animals over 3 independent experiments (5 scRNAseq libraries), n = 9 5dpi CTRL animals over 3 independent experiments (3 scRNAseq libraries) and n = 6 5dpi INH animals over 2 independent experiments (3 scRNAseq libraries). Scale bars: h, i: 50 μm. UMAP uniform manifold approximation and projection, dpi days post-injury, CTRL stab wound-injured control animals, INH stab wound-injured inhibitor-treated animals, INT intact.

