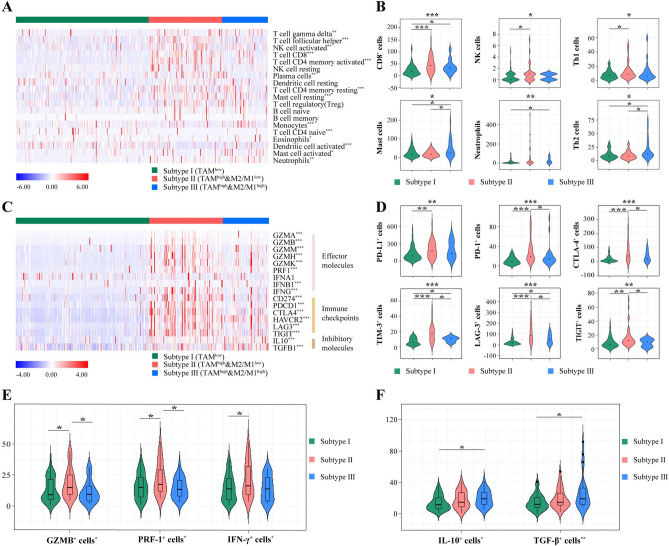
Fig. 3.
Stratification based on TAMs infiltration and M2/M1 ratio trichotomized distinct TME features in MIBC. A Heatmaps of immune cells infiltration with immune stratification in TCGA cohort. B Association between immune stratification and immune cells infiltration assessed by IHC staining in ZSHS cohort. C Heatmaps of gene expression involved in multiple immune response with immune stratification in TCGA cohort. D-F Association of immune stratification with immune checkpoint (D), effector cytokines (E), and immunosuppressive cytokines (F) expression assessed by IHC staining in ZSHS cohort. Data were analyzed by Kruskal–Wallis test. *P < 0.05, **P < 0.01 and ***P < 0.001

