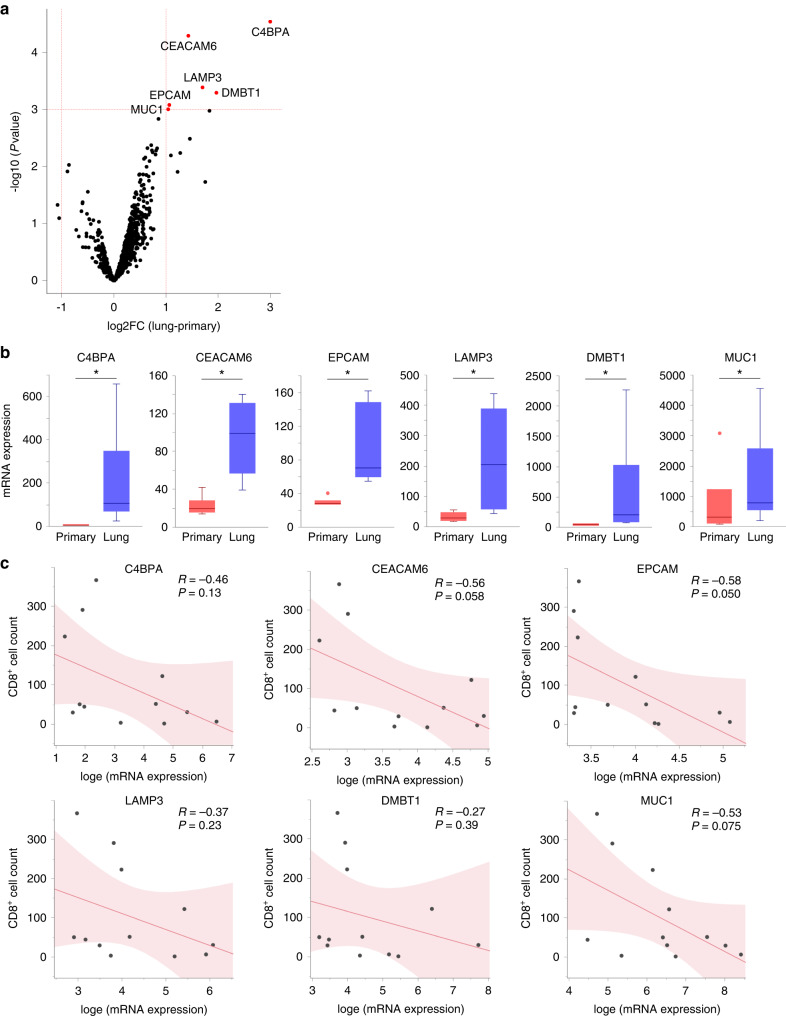
Fig. 3. Analysis of differentially expressed genes in primary and lung metastases of leiomyosarcoma in six patients.
Furthermore, correlation analysis was performed between the expression of the identified genes and the number of tumour-infiltrating CD8+ cells. a Volcano plot showing differentially expressed genes (DEGs) in corresponding lung metastases compared to primary leiomyosarcoma. Red dots indicate genes with statistically significant differences (fold-change >1.0, p < 0.001). b Comparison of gene expression levels in primary and lung metastases for each DEG. c Correlation analysis between gene expression levels and the number of tumour-infiltrating CD8+ cells based on immunohistochemical staining for each DEG (n = 12; 6 patients with primary tumours and 6 with lung metastasis). Gene expression levels were converted to natural logarithms. R represents the Pearson’s correlation coefficient. a, b DEG analysis was performed using the R package limma.

