Fig. 6.
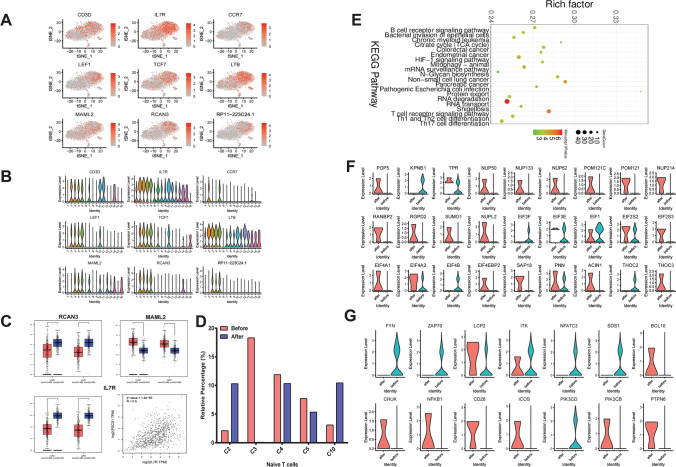
Naïve T cell clusters, markers and pathways changes after Pembrolizumab treatment. a, b T-SNE and violin plot of 9 cell markers of Naïve T cells (cluster 2, 3, 4, 5, 10). c Differential expression analysis and Pearson correlation analysis of cell markers of Naïve T cells using TCGA database. LUAD: lung adenocarcinoma, LUSC: lung squamous cell carcinoma. *p < 0.05. d The relative percentage of cluster 2, 3, 4, 5, 10 in before and after Pembrolizumab treatment samples. e KEGG enrichment analysis of differentially expressed genes in cluster 3. f, g The changes in expression of genes in RNA transport and T cell receptor pathways, in before and after Pembrolizumab treatment samples

