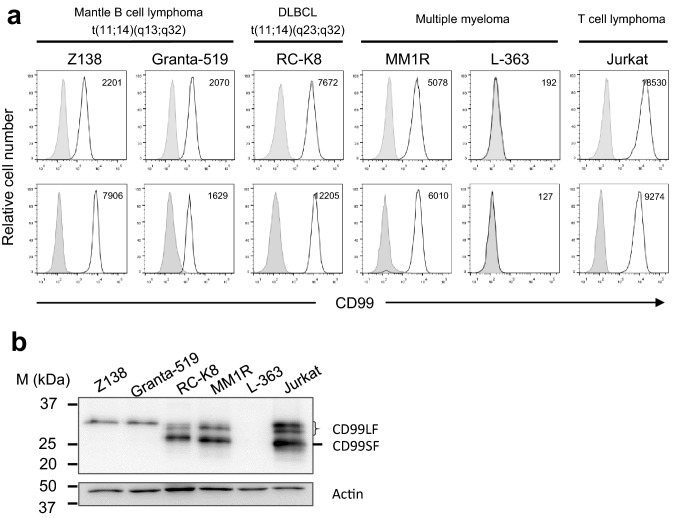
Fig. 1.
CD99 expression in malignant B-cell lines. a Direct immunofluorescence staining using commercial anti-CD99 mAb is shown in upper panel. The indicated cells were stained with PE-conjugated anti-CD99 mAb (white peak) or PE-conjugated isotype mAb (gray peak). Indirect immunofluorescence staining using mAb MT99/3 is shown in lower panel. Cells were stained with mAb MT99/3 (white peak) or isotype-matched control mAb (gray peak) followed by Alexa Flour-488-conjugated anti-mouse IgG (H + L) Abs. Mean fluorescence intensity (MFI) of CD99 expression is indicated at right upper corner of histogram graph. b Western blot analysis for CD99 isoform expression of the indicated cells is shown. Actin was used as a loading control. Jurkat T-cell line was used as a positive control of CD99 expression

