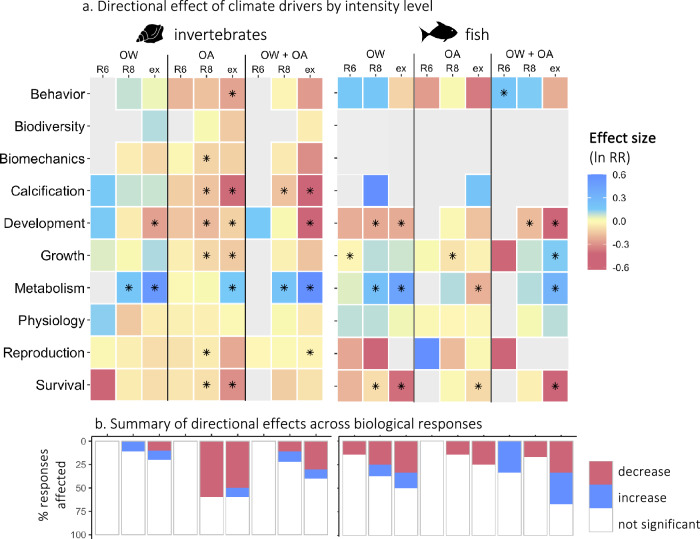
Fig. 5. Directional effects of climate drivers by intensity level.
a Directional effects (lnRR) of ocean warming (OW), ocean acidification (OA), and their combination (OW + OA) on biological responses of invertebrates (left) and fish (right) according to the intensity level considered (representative concentration pathway (RCP) 6 (R6), RCP 8.5 (R8), and extreme (ex)). The magnitude of effects is represented by a blue (increase) to magenta (decrease) color scale. Light gray tiles indicate an absence of data. Asterisks indicate significant effects. b Proportion of biological responses for which a significant increase (blue) or decrease (magenta) was found for each climate driver and intensity level. Source data are provided as a Source Data file. Fish and mollusc icons are available on the noun project website: https://thenounproject.com/icon/fish-1464319/ and https://thenounproject.com/icon/mollusk-5552214, respectively.

