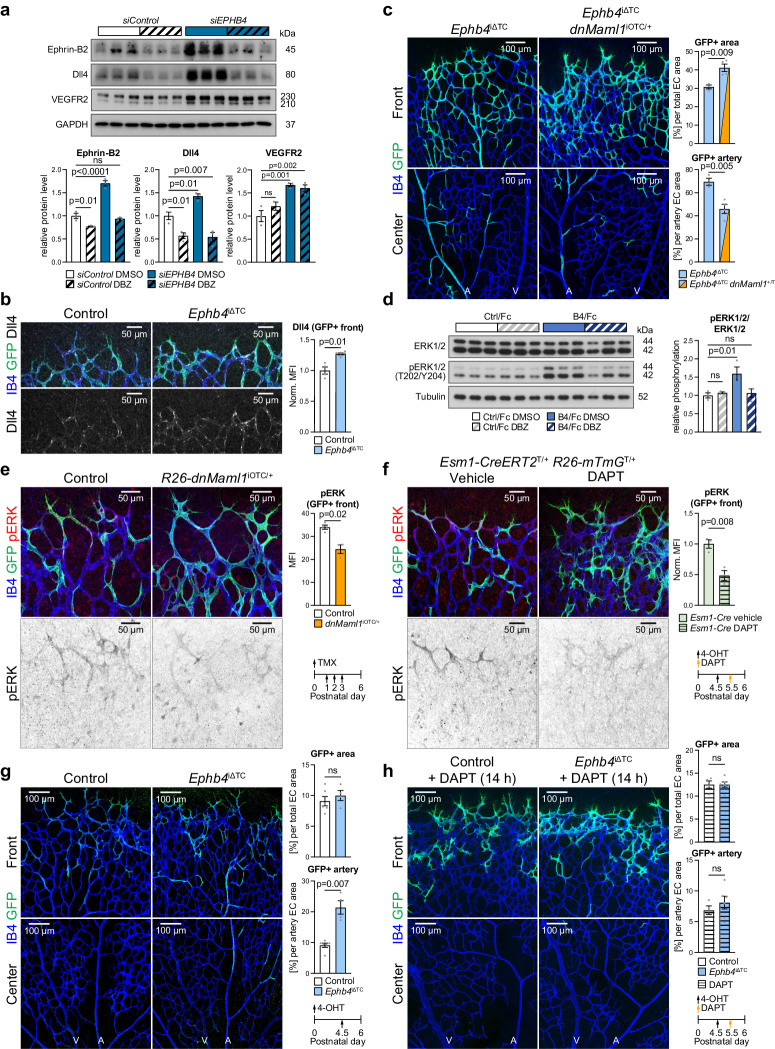
Fig. 6. EphB4 and Notch are linked to ERK1/2 activation.
a Notch inhibition (DBZ) impairs increase in ephrin-B2 and Dll4 in siEPHB4 HUVECs. Immunoblotting and quantitation of ephrin-B2, VEGFR2, and Dll4 in siControl and siEPHB4 cells treated with DBZ or vehicle (n = 3 experiments). b Increased Dll4 expression upon tip cell-specific Ephb4 inactivation. Quantitation of Dll4 immunosignal in the P6 retinal angiogenic front (n = 4 control and 6 Ephb4iΔTC). c Blocking Notch signaling via dominant-negative Mastermind Like Transcriptional Coactivator 1 (Maml1) reduces arterial incorporation of Ephb4iΔTC cells. Graphs show quantitation of total and arterial GFP+ area relative to EC area (n = 3 Ephb4iΔTC and 4 Ephb4iΔTC; R26-dnMaml1iOTC/+). d Reduced ERK1/2 activation upon EphB4/Fc stimulation combined with Notch inhibition. Immunoblot and quantitation of pERK1/2 in stimulated HUVECs treated with Notch inhibitor (DBZ) or vehicle (n = 3 experiments). e Tip cell-specific genetic inhibition of Notch signaling decreases ERK1/2 activation. Confocal images and quantitation of pERK in GFP+ cells at the vascular front of R26-dnMaml1iOTC/+ and control mice (n = 4 control and 3 R26-dnMaml1iOTC/+). f Acute Notch inhibition (DAPT) for 14 h reduces pERK. Graph shows quantitation of pERK MFI in GFP+ cells (n = 3 vehicle and n = 3 DAPT injected Esm1-CreERT2 R26-mTmG+/T animals). g Acute Ephb4 inactivation (single injection with 4-OHT) promotes arterial incorporation of tip cell progeny. Quantitation of total GFP+ area and GFP+ arterial area (n = 6 control and 4 Ephb4iΔTC mice). h Acute Notch inhibition (DAPT) impairs arterial incorporation of Ephb4-depleted ECs. Quantitation of total GFP+ area and of GFP+ area incorporated into artery per total EC area (n = 4 control + DAPT and 6 Ephb4iΔTC + DAPT mice). P values were calculated using two-tailed unpaired t test (b, c, e–h) and one-way ANOVA (a, d). In vivo experiments were performed with tamoxifen injections at P1-P3 with analysis at P6 (b, c, e) or 4-OHT injections at P4.5 following analysis at P6 (f–h) following analysis at P6. Data are presented as mean values ± SEM. Source data are provided as a Source Data file.

