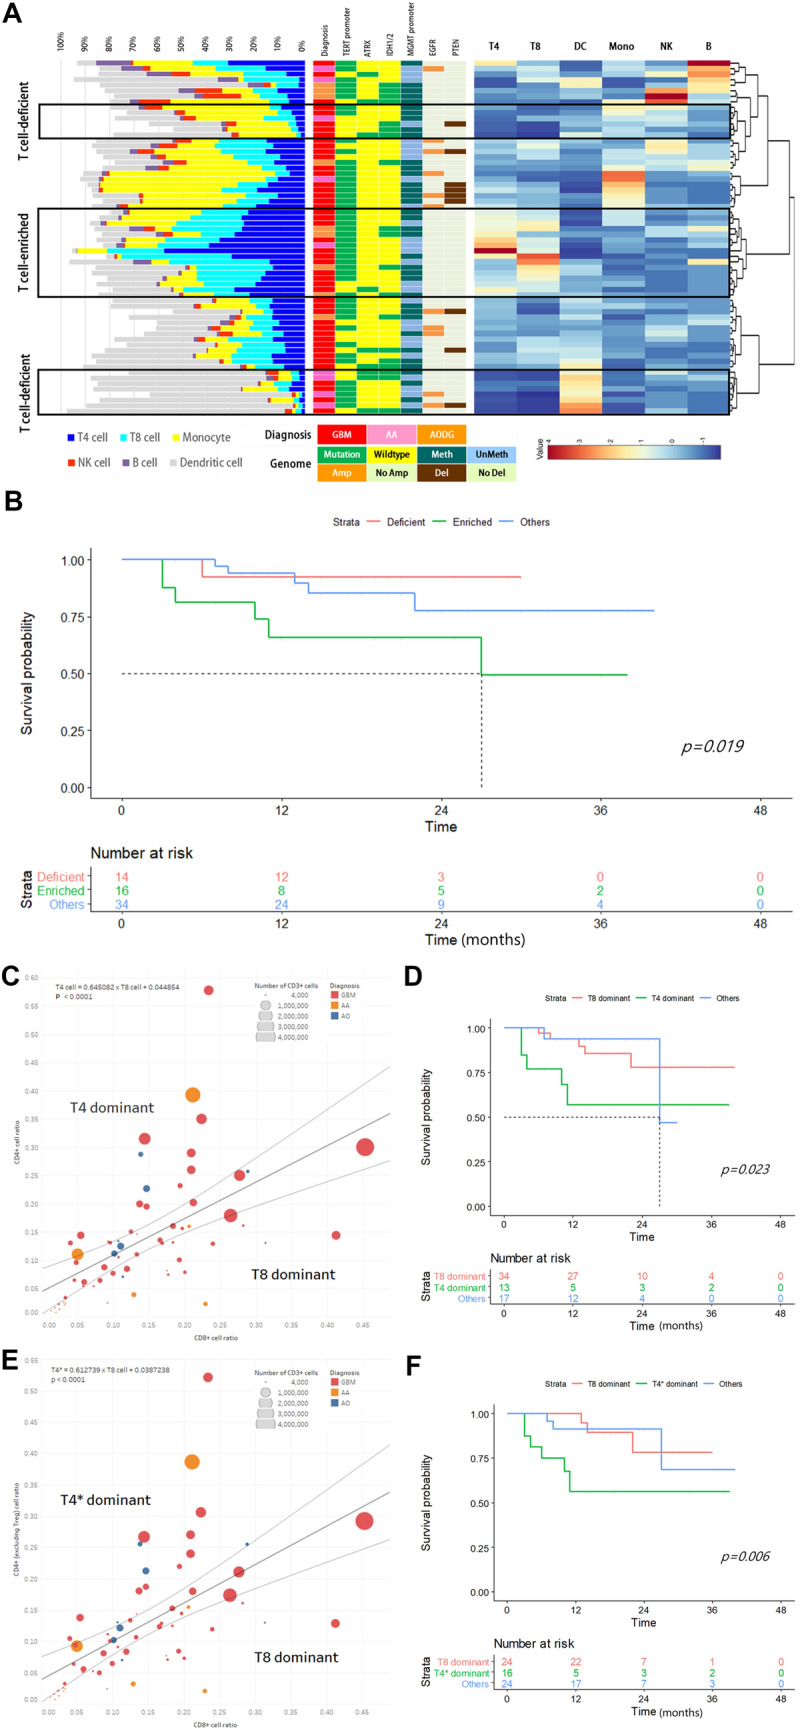
Fig. 2.

Quantification analysis of tumor-infiltrating T cells in high-grade gliomas and their prognostic impact. a Hierarchical clustering of the high-grade glioma tissue samples based on the numbers of major immune cell populations. Histological diagnosis and genetic signatures were matched with samples that exhibited no significant preponderance in classified T cell-enriched and T cell-deficient groups. b Significant survival differences in T cell-enriched and T cell-deficient groups (p = 0.019). c The ratio of CD4+ cells (T4 cells) to CD8+ cells (T8 cells) among CD45+ cells was plotted, and samples outside the 95% confidence interval of the linear regression line were defined as T4 dominant and T8 dominant groups. d The T8 dominant group showed a significant survival advantage over the T4 dominant group (p = 0.023). e The ratio of CD4+ cells (T4* cells) excluding CD4+FoxP3+CD25+ cells (Treg cells) and CD8+ cells (T8 cells) among CD45+ cells were plotted, and samples outside the 95% confidence interval of the linear regression line were defined as T4* dominant and T8 dominant groups. f The T8 dominant group showed a more profoundly significant survival advantage over the T4* dominant group (p = 0.006)
