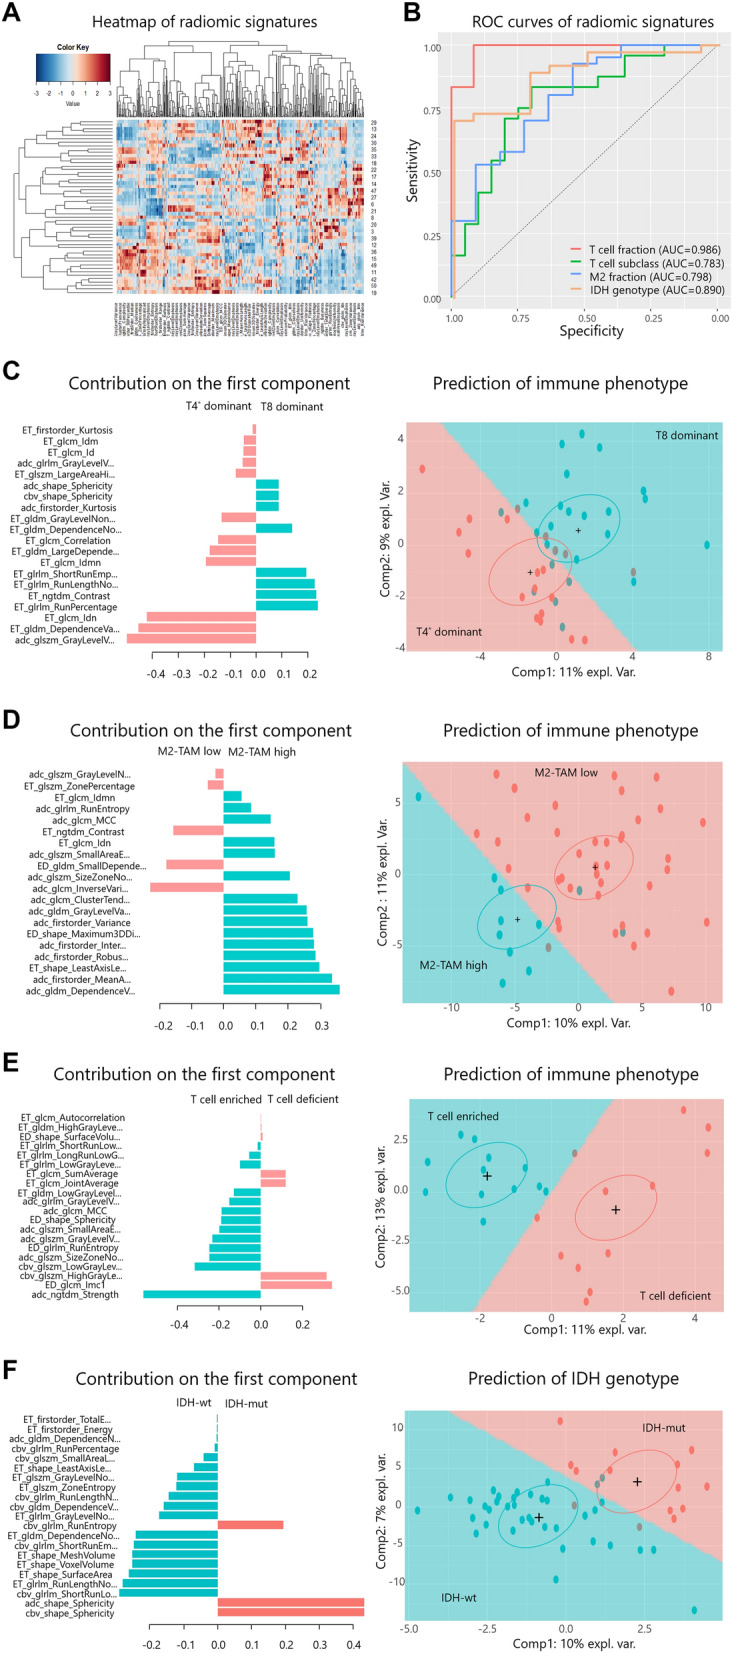
Fig. 4.

a Heatmap of radiomics features using hierarchical clustering with a dendrogram: rows indicate subjects (n = 51), and columns indicate multimodal radiomics features (d = 428). b Receiver operating characteristic (ROC) curves of radiomics signatures for immune phenotypes: T cell fraction (enriched vs deficient group) (red), area under the curve (AUC) = 0.986 (95% confidence interval (CI), 0.953–1) (p = 0.00005); T cell subclass fraction (T8 vs T4* dominant group) (green), AUC = 0.783 (0.643–0.923) (p = 0.001); M2 macrophage fraction (M2 high vs low group), AUC = 0.798 (0.652–0.944) (p = 0.003) (blue); and IDH genotype (IDH wt vs mut group), AUC = 0.890 (0.801–0.979) (p = 0.00002) (orange). c–f. Coefficients of variables of the first component of the radiomics signatures (left column) and prediction results for immune phenotypes (right column) of the T cell fraction (c), T cell subclass fraction (d), M2-TAM fraction (e), and IDH genotype (f). In the left column, the horizontal axis indicates the coefficients of the variables, and the vertical axis indicates the name of the variables. In the right column, the horizontal and vertical axes indicate the first and second components of the radiomics signatures, respectively. Note that crosses ( +) and surrounding ellipses indicate the centers of the group of subjects. ROC receiver operating characteristic, AUC area under the curve, expl. var. explained variance of each component, TAM tumor-associated macrophage
