Fig. 1.
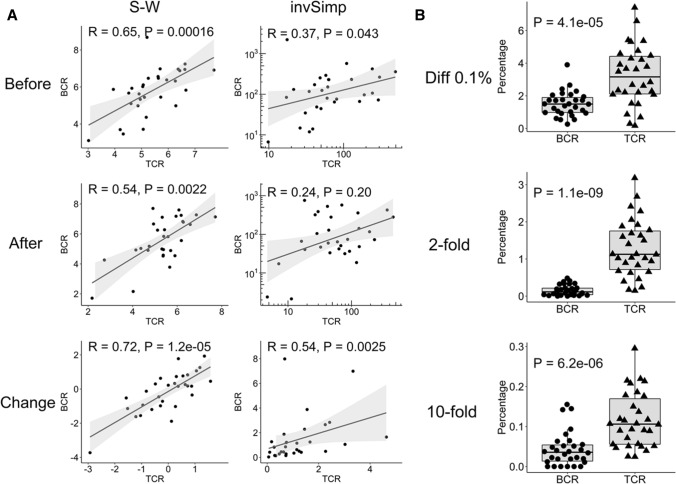
Correlation between TCR and BCR repertoire diversity. a The diversity of TCR or BCR repertoire was evaluated using two different methods, S–W index and invSimp index, before and after anti-PD-1 treatment. The correlation between the TCR and BCR diversity before and after treatment as well as that between post-treatment changes in TCR and BCR diversity was statistically analyzed by Spearman’s rank correlation coefficient. Each dot indicates an individual patient. A solid line with gray band shows linear correlation with 95% confidence intervals. For invSimp index, double logarithmic scaling plot was used before and after treatment, and log10 fold change values were used for the post-treatment changes. b The frequencies of TCR and BCR clones that increased by more than 0.1% (Diff 0.1%) or by more than twofold or tenfold after treatment were assessed and compared. Statistical significances were tested by paired Wilcoxon rank sum test

