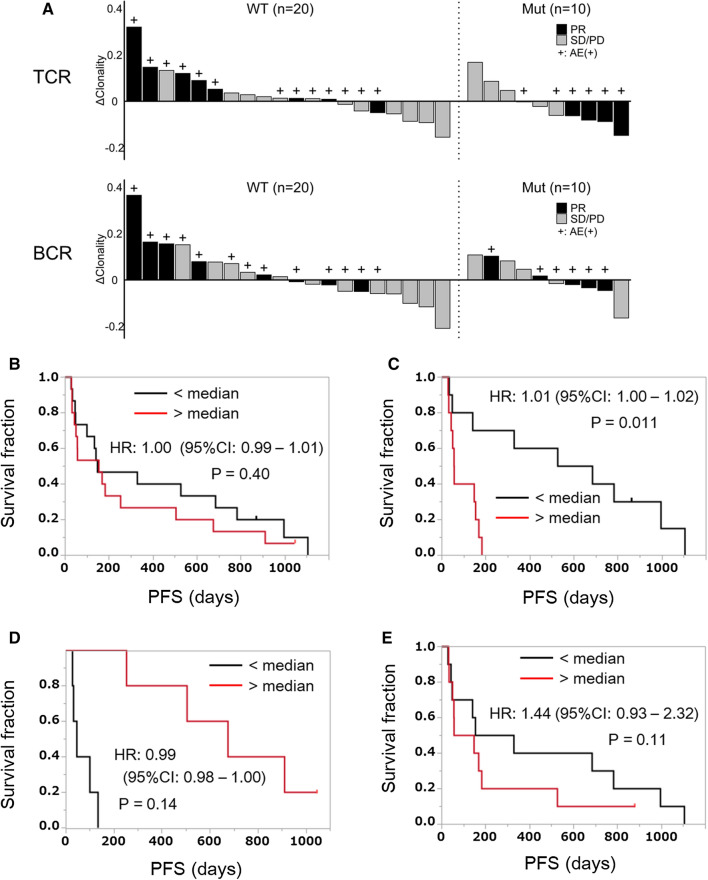
Fig. 5.
Difference in the clinical significance of the TCR or BCR repertoire diversity between patients with and without EGFR/ALK mutation. a Post-treatment changes in TCR (upper) and BCR (lower) clonality as well as antitumor responses or AE occurrence were shown in each patient in the subset with (Mut, n = 10) and without (WT, n = 20) EGFR/ALK mutation. The clonality index was calculated as [1—the normalized S–W index]. Each vertical bar indicates an individual patient arranged in the order of post-treatment change of the clonality index (ΔClonality). b All the enrolled patients (n = 30) were divided into two groups based on the median value of post-treatment changes in the TCR repertoire diversity (evaluated by invSimp index). Kaplan–Meier plots of PFS for low and high groups were shown. The difference was evaluated statistically using the Cox proportional hazard model, and hazard ratio (HR), 95% confidence interval (95%CI) and P value were shown. c Patients without EGFR/ALK mutation (n = 20) were divided into two groups based on the median value of post-treatment changes in the TCR repertoire diversity (evaluated by invSimp index). Kaplan–Meier plots of PFS for low and high groups were shown. The difference was evaluated statistically using the Cox proportional hazard model, and HR, 95% CI and P value were shown. d Patients with EGFR/ALK mutation (n = 10) were divided into two groups based on the median value of post-treatment changes in the TCR repertoire diversity (evaluated by invSimp index). Kaplan–Meier plots of PFS for low and high groups were shown. The difference was evaluated statistically using the Cox proportional hazard model, and HR, 95% CI and P value were shown. e Patients without EGFR/ALK mutation (n = 20) were divided into two groups based on the median value of post-treatment changes in the BCR repertoire diversity (evaluated by S–W index). Kaplan–Meier plots of PFS for low and high groups were shown. The difference was evaluated statistically by the Cox proportional hazard model, and HR, 95% CI and P value were shown

