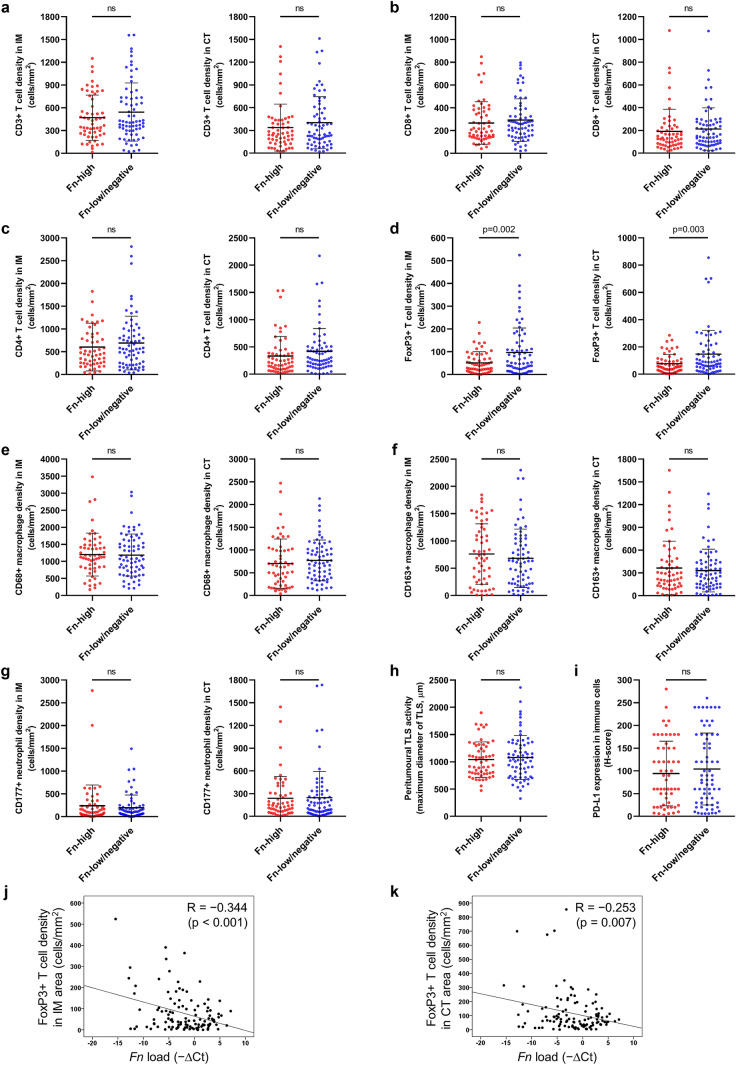
Fig. 1.
Comprehensive analysis of tumor-infiltrating immune cells and immune responses according to Fn status in MSI-high CRCs. a Comparisons of CD3+ T cell densities of IM (left) or CT (right) area between Fn-high and Fn-low/negative MSI-high CRCs. b Comparisons of CD8+ T cell densities of IM (left) or CT (right) area between Fn-high and Fn-low/negative MSI-high CRCs. c Comparisons of CD4+ T cell densities of IM (left) or CT (right) area between Fn-high and Fn-low/negative MSI-high CRCs. d Comparisons of FoxP3+ T cell densities of IM (left) or CT (right) area between Fn-high and Fn-low/negative MSI-high CRCs. e Comparisons of CD68+ macrophage densities of IM (left) or CT (right) area between Fn-high and Fn-low/negative MSI-high CRCs. f Comparisons of CD163+ macrophage densities of IM (left) or CT (right) area between Fn-high and Fn-low/negative MSI-high CRCs. g Comparisons of CD177+ neutrophil densities of IM (left) or CT (right) area between Fn-high and Fn-low/negative MSI-high CRCs. h A comparison of peritumoral TLS activity (maximum diameter of the largest TLS) between Fn-high and Fn-low/negative MSI-high CRCs. i A comparison of PD-L1 expression in immune cells (H-score of PD-L1 immunohistochemical staining in immune cells) between Fn-high and Fn-low/negative MSI-high CRCs. (j, k) Correlation scatter plots between Fn load and FoxP3+ T cell density of the IM (j) or CT (k) area in MSI-high CRCs

