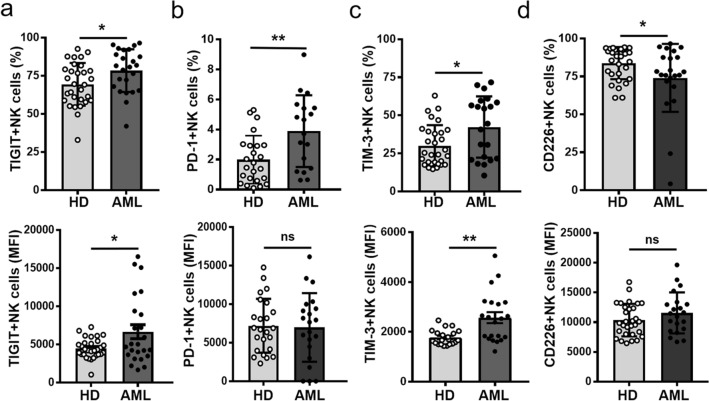
Fig. 1.
Abnormal immune checkpoints expression on NK cells in AML patients. Quantification of the frequency (top) and expression level (MFI) (bottom) of TIGIT a, PD-1 b, TIM-3 c, CD226 d on CD45+CD3−CD56+NK cells from PBMCs of AML patients or HD by flow cytometry. Each symbol represents one subject, and the data are shown as the mean (± SEM). HD, healthy donors. P values, unpaired two-tailed t-test (a, b, c, d), *, P < 0.05; **, P < 0.01; ***, P < 0.001. ns, no significant difference

