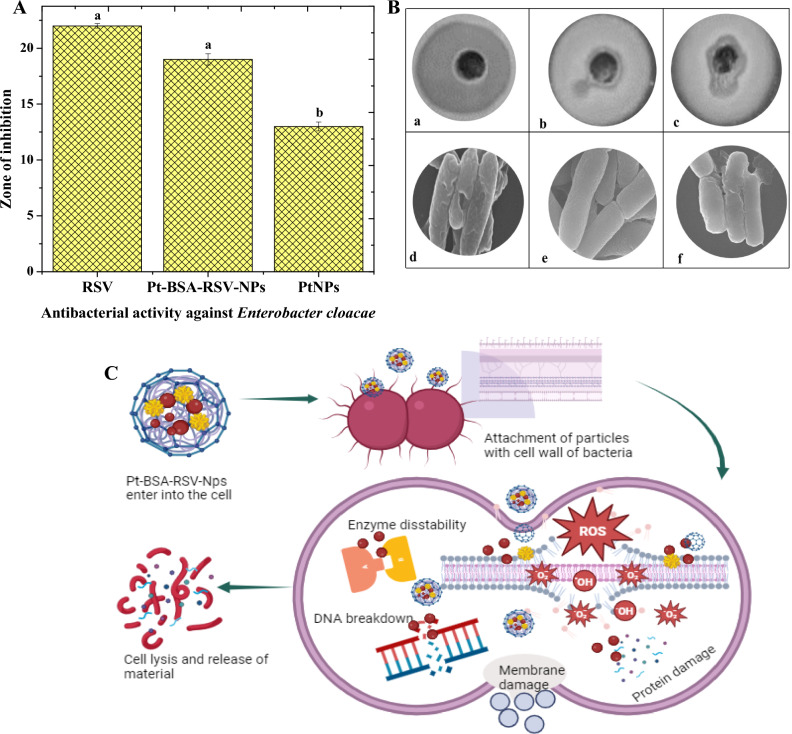
Figure 7.
Graphical representation of inhibition zones for Enterobacter cloacae (A) Different letters are assigned to means when they are statistically significant (p-value < 0.05), while identical letters denote changes that are not significant. Pt-BSA-RSV-NPs activity against Enterobacter cloacae., Pt-BSA-RSV-NPs (a), RSV (b), and PtNPs (c) the SEM images of respective (d–f). (B) Schematic antibacterial mechanism of Pt-BSA-RSV-NPs (C).

