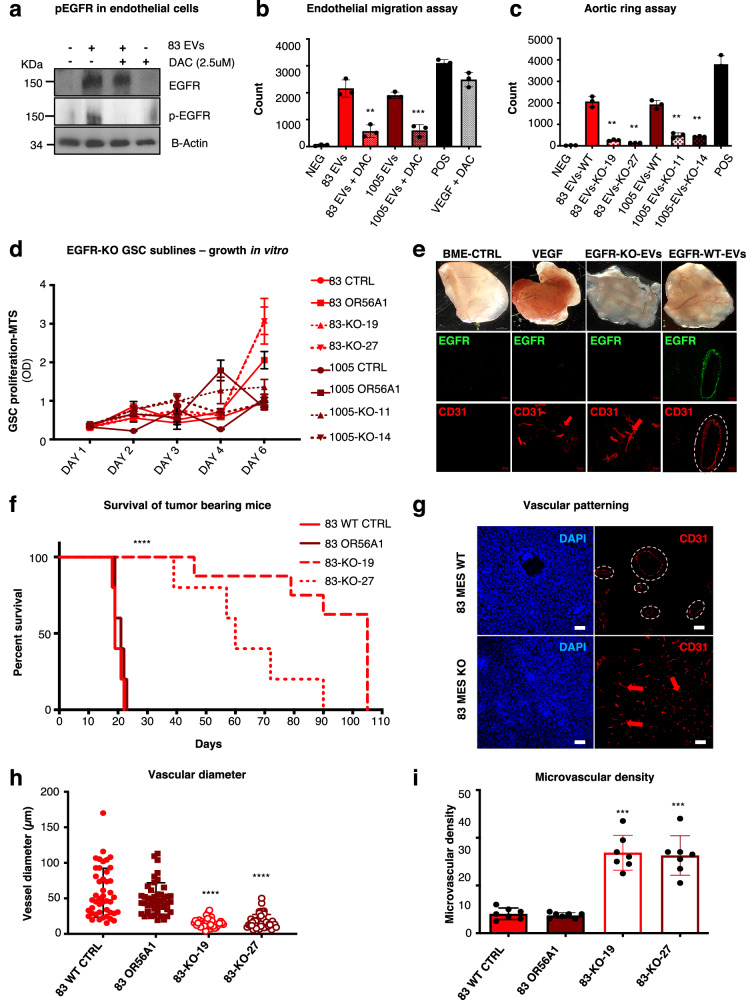
Fig. 3. Obliteration of GSC-EV-derived EGFR in endothelial cells suppresses cellular responses to extracellular vesicles and alters vascular patterning in vivo.
a Activation of EGFR in endothelial cells following EV transfer from cancer cells is obliterated by the pan-ErbB inhibitor, Dacomitinib. EGFR phosphorylation in primary endothelial cells is completely inhibited by 2.5 μM of Dacomitinib treatment (n = 3 independent experiments); b Dacomitinib inhibition of endothelial cell migration triggered by EGFR-carrying EVs. Endothelial cells were treated with MES EVs or VEGF and 6 h later exposed to 2.5 μM of Dacomitinib. The number of cells migrated was assessed using FIJI software (n = 6 wells/3 independent experiments; two-tailed paired t test P = 0.0022 and 0.00077); c EGFR depletion reduces the ability of GSC EVs to trigger endothelial cell outgrowths. Endothelial cells were treated with 30 μg/ml of EVs obtained from glioma stem cells either deficient (EGFR-KO, clone 19 and 27), or proficient (EGFR-WT) for EGFR. After 3 days of incubation, cells were fixed, stained with crystal violet and imaged (n = 3 independent experiments; two-tailed paired t test; GSC83 (83): P = 0,00024 and 0,00018; GSC1005 (1005): P = 0.00041 and 0.00019); d Proliferation assay reveals similar growth pattern in culture of glioma stem cells deficient (EGFR-KO) or proficient (EGFR-WT) for EGFR (n = 3 independent experiments); e Appearance of freshly removed BME plugs containing indicated agents three weeks after implantation. BME-embedded EVs were obtained from glioma stem cells: EGFR-KO, EGFR-WT, while control plugs contained VEGF, or vehicle. Scale bars are 20 µm (n = 4 independent experiments); f Kaplan-Meier survival curves of mice bearing EGFR-KO and EGFR-WT MES GSC-driven tumours (n = 5 mice per group); g Representative images of immunofluorescence for CD31 reveals differential vascular patterns between tumours driven by EGFR-WT or EGFR-KO MES-GSCs (GSC83). Scale bars are 20 µm; n = 5 independent experiments have been conducted; two-tailed paired t test P = 0,0008; h Quantification of vessel size distribution according to staining for CD31-positive endothelial cells (n = 5 independent experiments; two-tailed paired t test P = 1.45−12 and 3.41−11); i Quantification of microvascular density using CD31 staining (n = 5 independent experiments; two-tailed paired t test P = 1.39−06 and 7.15−06). Microvascular density was expressed as vessel density per high power field (hpf). Data were presented as means ± SD. Significance: **p < 0.01, ***p < 0.001, ****p < 0.0001 of the treated group versus untreated control group; Source data are provided as a Source Data file.

