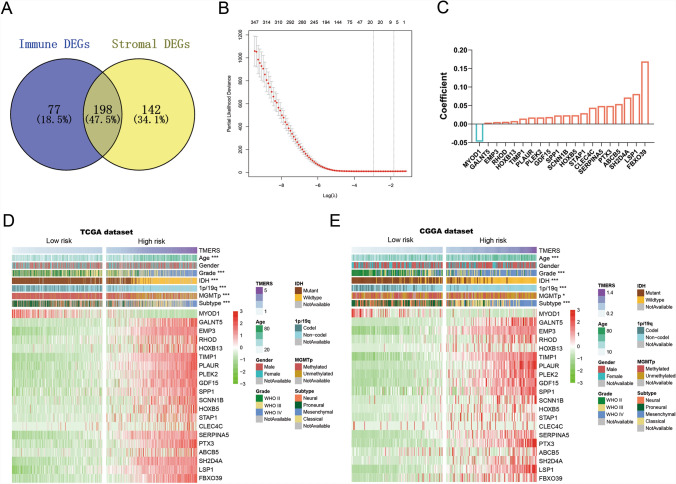
Fig. 2.
Identification of TME-related signature. A Venn diagram showed the differentially expressed genes (DEGs) of immune score and stroma score. B In LASSO regression analysis, partial likelihood deviance plot showed cross-validation for tuning parameter screening. C 20 genes were screened and corresponding regression coefficients in LASSO regression. Heatmaps showed the clinical and pathological differences between low risk and high risk patients in TCGA dataset (D) and CGGA dataset (E)

