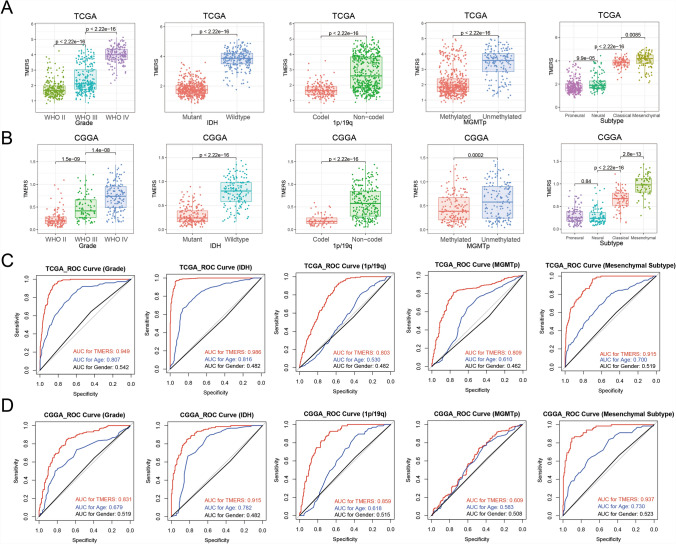
Fig. 3.
Associations between TMERS and pathological features. In TCGA dataset (A) and CGGA dataset (B), patients were grouped by WHO grade, IDH mutation status, 1p/19q codeletion status, MGMT promoter methylation status, TCGA molecular subtype. In TCGA dataset (C) and CGGA dataset (D), the ROC curve evaluated the predictive value of TMERS in pathological features

