Fig. 7.
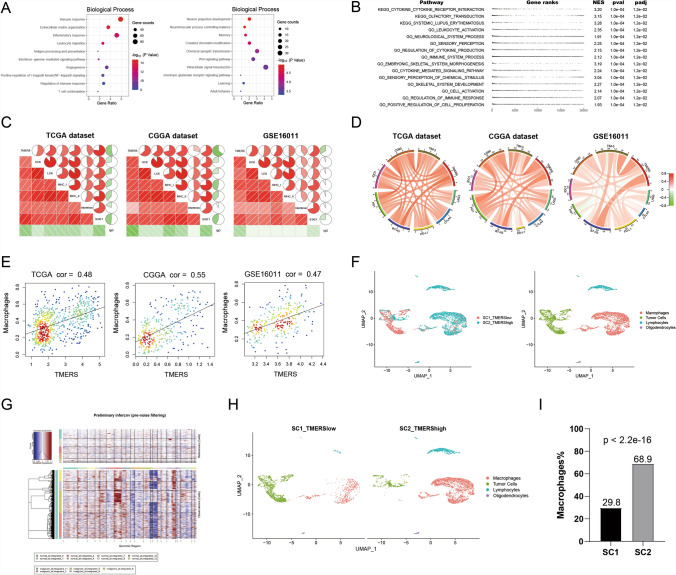
Functional annotation and immunological analysis of TMERS. A Biological processes analysis of genes positively or negatively associated with TMERS using DAVID functional annotation tool. B Gene set enrichment analysis (GSEA) revealed the top 15 pathways which were enriched in TMERS-high group. C Correlation analysis of TMERS and inflammatory activities in three datasets. D Correlation analysis of TMERS and immune checkpoints in three datasets. E Correlation analysis of TMERS and macrophage proportions by CIBERSORT in three datasets. F Two single-cell RNA-sequencing samples (SC1 was TMERS-low and SC2 was TMERS-high) were integrated, and all cells were labeled as four clusters: macrophages (red), tumor cells (green), lymphocytes (blue), oligodendrocytes (purple). G The InferCNV heatmap showed single cell chromosome copy number amplification (red) or deletion (blue). The upper part was reference normal cells, the lower part was malignant cells. H SC1 (left) and SC2 (right) in the UMAP plot. I The proportion of macrophages in SC1 was significantly lower than that in SC2 (p < 2.2e-16, chi-squared test)

