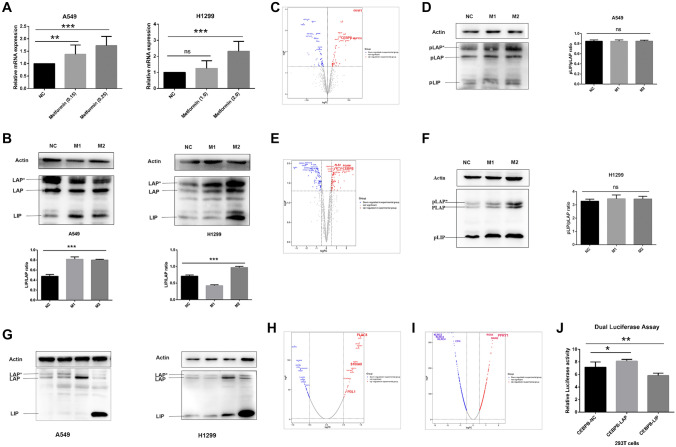
Fig. 2.
Overexpression of LAP and LIP had opposite effects on PDL1 expression. A qPCR showed that the expression of CEBPB-mRNA was increased significantly in both A549 and H1299. B Western blot analysis showed that both the expression of CEBPB-LAP and CEBPB-LIP increased. The ratio of LIP/LAP increased. C The phosphorylated protein profile of A549 treated with metformin was analyzed. D The expression of pLAP*, pLAP, and pLIP phosphorylated levels in A549 cells was upregulated, but the ratio of pLIP/pLAP did not change significantly (0.849 vs. 0.849 vs. 0.850; P = 0.998). E The phosphorylated protein profile of H1299 treated with metformin was analyzed. F The expression of pLAP*, pLAP, and pLIP phosphorylated levels in H1299 cells was upregulated, but the ratio of pLIP/pLAP did not change significantly (3.282 vs. 3.458 vs. 3.443; P = 0.589). G CEBPB-LAP*, CEBPB-LAP, and CEBPB-LIP and control cell line CEBPB-NC cell lines were constructed. (H, I) Gene-chip results showed the differential expressed genes in A549-LAP-OE cells and LIP-OE cells. h Dual-luciferase reporter assays showed the RLU1/RLU2 of the LAP-OE group was significantly increased (7.146 vs. 8.128, P = 0.023), and the RLU1/RLU2 of the LIP-OE group was significantly reduced (7.146 vs. 5.830, P = 0.006). Metformin concentration. NC: no metformin treatment. M1: 0.15 mmol/L (A549), 1 mmol/L (H1299). M2: 0.25 mmol/L (A549), 2 mmol/L (H1299)

