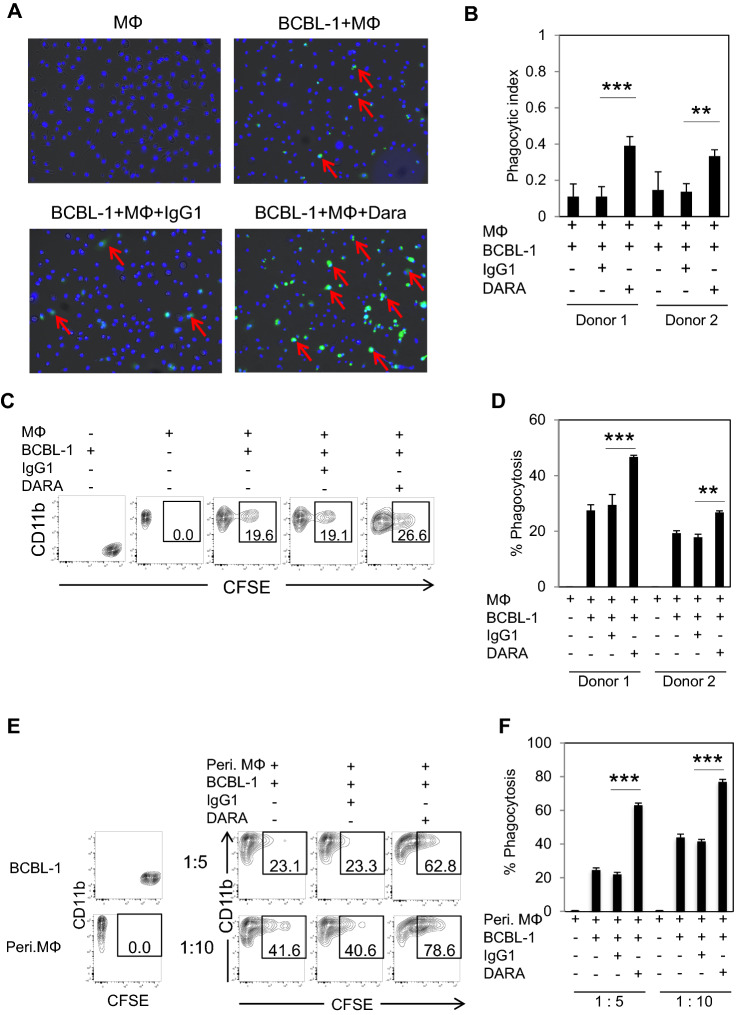
Fig. 5.
DARA demonstrates ADCP toward primary effusion lymphoma. A MDMs from one representative healthy donor were plated into a glass-bottomed dish. CFSE-labeled BCBL-1 cells were incubated with either DARA or IgG1 antibody for 15 min at room temperature. Next, antibody coating CFSE-labeled BCBL-1 cells were added to the wells of MDMs (E: T ratio = 1:5) and further incubated for 2 h. The nuclei of the MDMs cells were stained with Hoechst 33342, shown in blue, whereas BCBL-1 cells were seen as green fluorescence. Phagocytic cells are indicated by red arrows. B Data are presented as a phagocytic index, calculated as the number of phagocytic CFSE+Hoechst 33342+ per 100 MDMs. C MDMs from one representative healthy donor were plated into a well. CFSE-labeled BCBL-1 cells were incubated with either DARA or IgG1 antibody for 15 min at room temperature. The antibody coating CFSE-labeled BCBL-1 cells were added to the well of MDMs (E: T ratio = 1:2) and further incubated for 2 h. Phagocytic cells were defined as CD11b+CFSE+ cells. D Data are presented as the % phagocytosis (CD11b+CFSE+ cells) of two healthy donors. The data are presented as mean values ± the standard error (SE). *P < 0.05, **P < 0.01, ***P < 0.001, ****P < 0.0001. E Peritoneal macrophages from BRJ mice were plated into a well. CFSE-labeled BCBL-1 cells were incubated with either DARA or IgG1 antibody for 15 min at room temperature. The antibody coating CFSE-labeled BCBL-1 cells were added to the well of macrophages at the indicated ratios and further incubated for 2 h. Phagocytic cells were defined as CD11b+CFSE+ cells. F Data are presented as the % phagocytosis (CD11b+CFSE+ cells). The data are presented as mean values ± the standard error (SE). *P < 0.05, **P < 0.01, ***P < 0.001, ****P < 0.0001 significant levels

