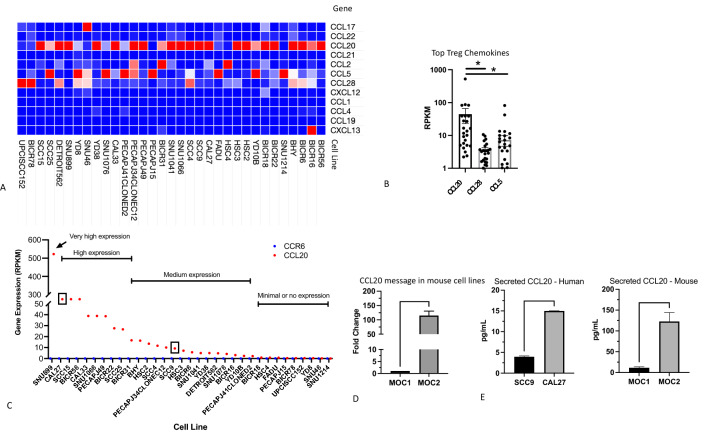
Fig. 1.
Analysis of Treg chemokines in HNSCC cell lines. a Heat map of Treg chemokines in 33 HNSCC cell lines analyzed from the CCLE. b Statistical analysis of the top 3 most frequently expressed Treg chemokines in human HNSCC cell lines. Two-way ANOVA was used to assess statistical significance. c Categorization of HNSCC cell lines based on levels of CCL20 expression (red dots). None of the cell lines expressed the CCL20 receptor, CCR6 (blue dots). d qPCR analysis of transcript levels of CCL20 in MOC1 and MOC2 mouse HNSCCs. Expression was normalized to MOC1. e Analysis of secreted CCL20 in human and mouse cell lines. Error bars represent SEM of 4–5 independent experiments. Asterisks show statistical significance

