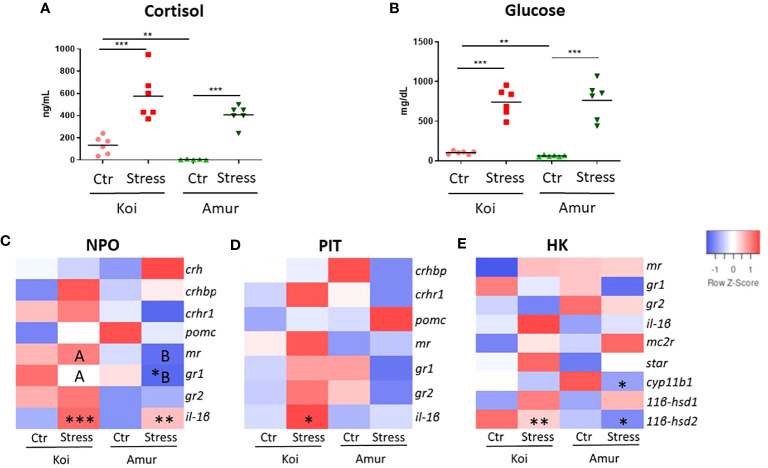
Figure 1.
Level of (A) cortisol (ng/mL) and (B) glucose (mg/dL) in blood plasma of unstressed (Ctr) and stressed (Stress) koi and Amur sazan. Heatmaps showing changes in the constitutive expression of stress-involved genes revealed by RT-qPCR in: (C) hypothalamic nucleus preopticus (NPO), (D) pituitary gland (PIT), and (E) head kidney (HK) of unstressed and stressed koi and Amur sazan. Asterisks indicate statistically significant differences between the studied group (A, B) or between unstressed and stressed fish within the strain (C–E) (*p ≤ 0.05; **p ≤ 0.01; ***p ≤ 0.001). Different capital letters (e.g., A vs. B) indicate statistically significant differences at p ≤ 0.05 between stressed koi and stressed Amur sazan (C–E). Statistical analysis was performed by two-way ANOVA with subsequent pairwise multiple comparisons using the Holm–Sidak test. The data are presented as n = 6 individual values with the mean indicated as a horizontal line (A, B) or as the mean of n = 6 fish (C–E).

