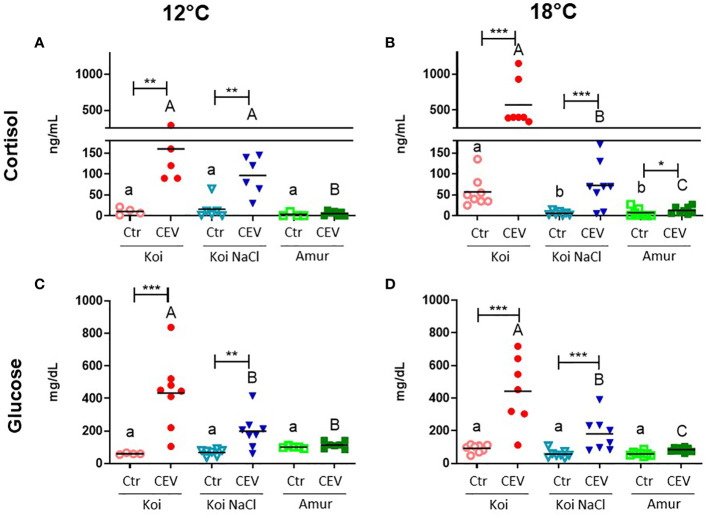
Figure 4.
Level of (A, B) cortisol and (C, D) glucose in the blood plasma of uninfected (Ctr) and CEV-infected (CEV) fish from three groups of carp: koi (Koi), salt-treated koi (Koi NaCl), and Amur sazan (Amur) kept at 12°C or 18°C (6 days post exposure). Asterisks indicate statistically significant differences between uninfected and CEV-infected within the strain/group (*p ≤ 0.05; **p ≤ 0.01; ***p ≤ 0.001). Different lowercase letters (e.g., a vs. b) indicate statistically significant differences at p ≤ 0.05 between the groups of uninfected fish. Different capital letters (e.g., A vs. B) indicate statistically significant differences at p ≤ 0.05 between the groups of CEV-infected fish. Statistical analysis was performed using two-way ANOVA with subsequent pairwise multiple comparisons using the Holm-Sidak test. The data are presented as n = 5–8 individual values with the mean indicated as a horizontal line.

