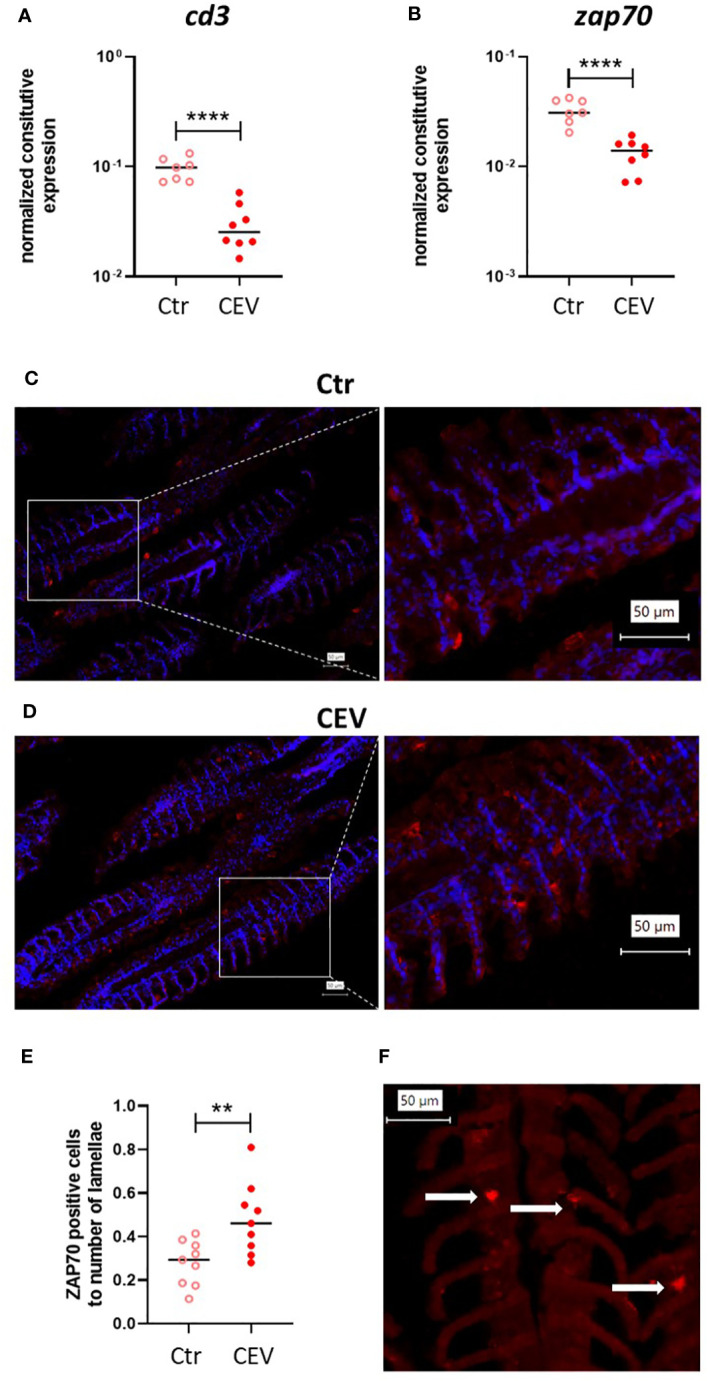
Figure 9.

Expression of cd3 (A) and zap70 (B) in the gills of control (Ctr) and CEV-infected (CEV) koi kept at 18°C (6 days post exposure). Immunofluorescent staining of ZAP70-positive cells (in red) and nucleus (in blue) in the gills of control (Ctr) and CEV-infected (CEV) koi [(C, D), respectively] and the ratio of the number of ZAP70-positive cells to the number of lamellae (E). Only ZAP70-positive cells [(F) white arrows] associated with the secondary lamella were counted using digitally magnified images. The following procedure was used for counting ZAP70-positive cells: (i) counting the secondary lamellae, (ii) counting the positive cells on previously counted lamellae, (iii) counting the ratio of ZAP70-positive cells to the number of secondary lamellae. Asterisks indicate statistically significant differences between control and CEV-infected koi (**p ≤ 0.01; ****p ≤ 0.0001). Statistical analysis was performed using t-test. The data for gene expression are presented as n = 7–9 individual values with the mean indicated as a horizontal line. The data for ZAP70-positive cells are presented as three values from three different individuals with the mean indicated as a horizontal line.
