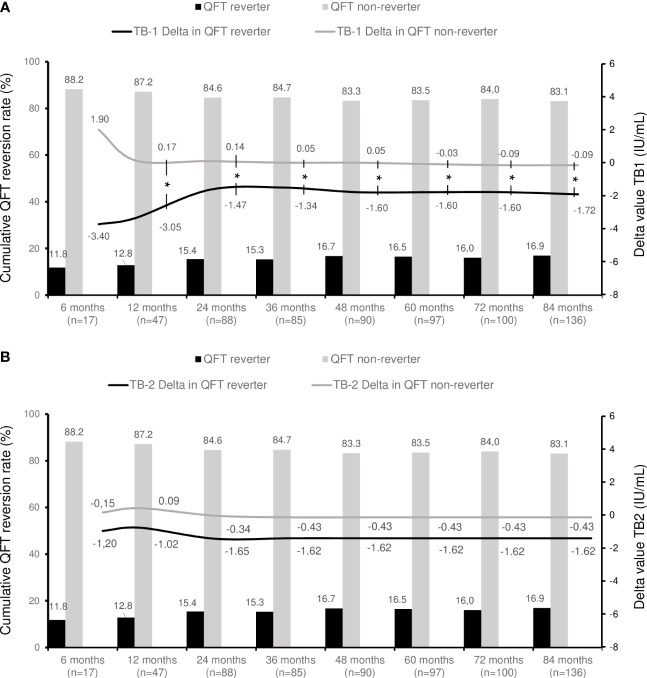
Figure 1.
QuantiFERON dynamics over time in the study population. Bar chart represents the cumulative rate of QFT reversion during follow up. Lines depict the extent of change of TB1 (A) and TB2 (B) quantitative results using delta values for patients who revert QTF compared to those who do not (background-corrected with Nil tube). (QFT), QuantiFERON-TB. (n), number of patients. Distributions were no normal and comparisons were made with the Mann-Whitney’s t-test. *Statistically significant difference in delta values between patients with QFT reversal and those who do not.

